
Elasticsearch vs OpenSearch vs Luxir: Full-Text Search Benchmarks
On a 10 million document Wikipedia index, Luxir answered full-text queries faster than Elasticsearch 9.5 and OpenSearch 3.8 on every one of 60 query types at 1 and 8 client connections, and on 58 of 60 at 32 connections. The two exceptions are ties: Elasticsearch counted the matches of AND and OR queries over two frequent terms about 1% faster. Taking the geometric mean across query types, Luxir’s throughput is 1.6 times Elasticsearch’s and 2.0 times OpenSearch’s with one connection, and much the same with 8. With 32 connections it is 2.1 and 3.0 times, but part of that is the reference engines stalling on phrase queries under load, for a reason I have not identified. Over the other query types it is 1.6 and 2.5 times. The spread behind those averages is wide, from those ties to 10 times, so the results by query type below matter more than the average.
Elasticsearch and OpenSearch are within 20% of each other on term, phrase, and sloppy phrase queries at 32 connections. They have diverged elsewhere. Elasticsearch is 3.7 to 7.3 times faster than OpenSearch at exact counts of AND and OR queries over frequent terms, and 2.8 to 9.8 times faster on wildcard, three-character prefix, and regex queries. OpenSearch is 1.8 times faster than Elasticsearch at the top 10 for an OR of a frequent and a rare term.
For a closer look at those differences, see Elasticsearch vs OpenSearch, with two-engine charts and comparisons across all three connection counts.
| Results as of | 2026-09-20 |
| Elasticsearch | 9.5.4, official distribution, bundled JDK (OpenJDK 26.0.2), 8 GiB heap |
| OpenSearch | 3.8.0, official distribution, bundled JDK (Eclipse Temurin 25.0.4), 8 GiB heap |
| Luxir | A pre-release build of 0.1.0: commit 547d8a1 -march=native |
| Hardware | munin: AMD Ryzen 9 9955HX (16 cores, 32 threads), 64 GB RAM, NVMe. 14 cores for the server, 2 for the load driver |
| Caches | Query caches and request caches off for all engines, so query execution is what gets measured |
| SearchBench | luxir-search/searchbench, measured at the tag fulltext-munin-host-20260920 on my fork |
| Raw results | Release fulltext-munin-host-20260920: the JSON for every measured cell and the generated report, with a SHA-256 checksum |
| Full details | The complete report: every cell, engine startup settings, the exact requests sent with a sample of each response, and count agreement |
Summary
Section titled “Summary”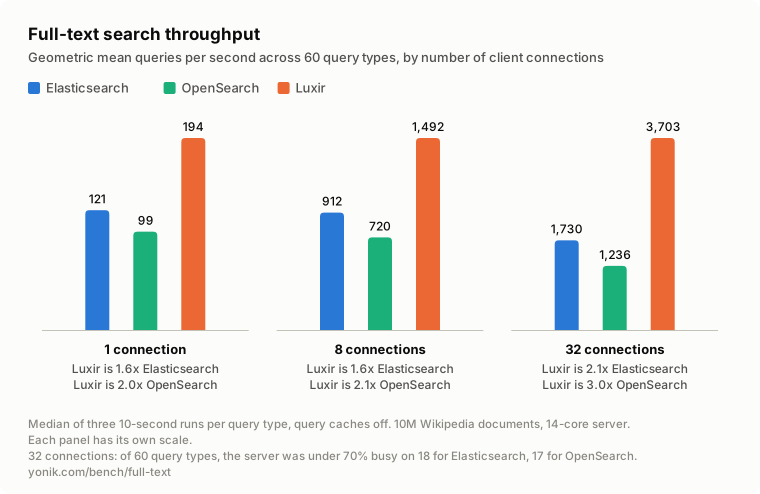
SearchBench’s own reports keep every query type separate and never pool them, because a pooled number hides exactly the differences a developer needs to see. For a summary I have pooled them anyway. Each column is the geometric mean of the median queries per second over all 60 query types. The ratio between two columns is then the geometric mean of the per-type speedups, so no single fast or slow query type dominates it. It is a summary, not the throughput of any real workload.
The 32-connection panel needs a caveat. On the 18 phrase and sloppy phrase query types, the reference engines keep an average of only 12 of the server’s 28 threads busy at 32 connections, which is covered under Scaling with load. Over the other 42 query types, Luxir’s throughput at 32 connections is 1.6 times Elasticsearch’s and 2.5 times OpenSearch’s, in line with the lighter loads.
Six Luxir cells, the three term-count query types at 8 and 32 connections, saturated the load driver. Those are lower bounds, so the chart understates Luxir there.
Results by query type
Section titled “Results by query type”These are the results at 32 connections. Each dot is an engine’s queries per second on a log scale, so the same ratio is the same distance anywhere on the axis. The multiples are of the slowest engine for that query type. Two marks flag a rate that was not limited by the server’s CPU: an asterisk where the load driver was saturated, and a dagger where the server was under 70% busy, which is the subject of Scaling with load. The results at 1 and 8 connections are in the complete report.
Top 10 results
Section titled “Top 10 results”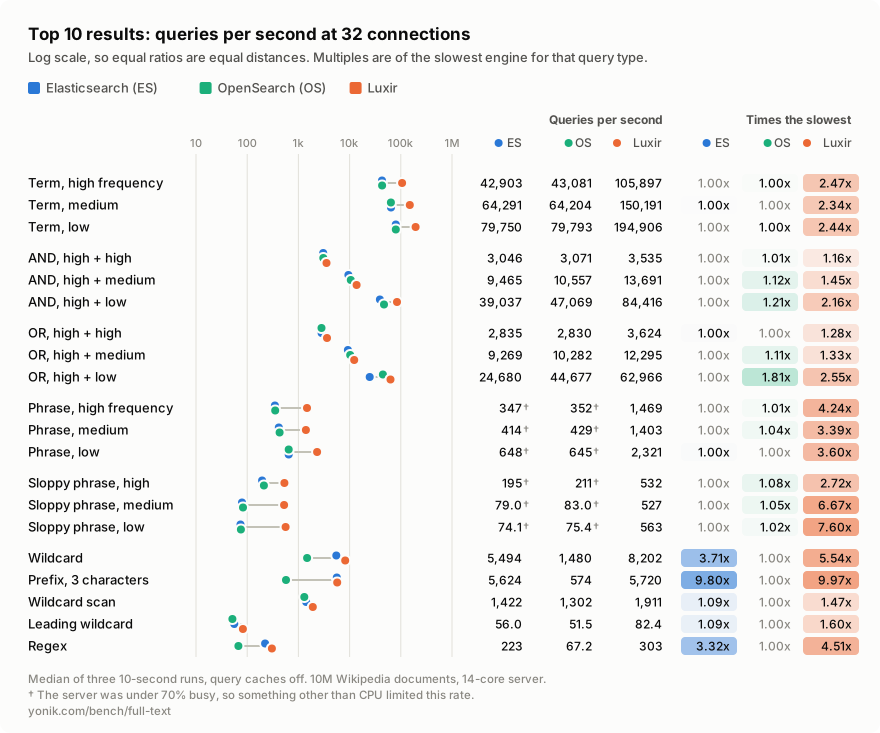
Top 100 results
Section titled “Top 100 results”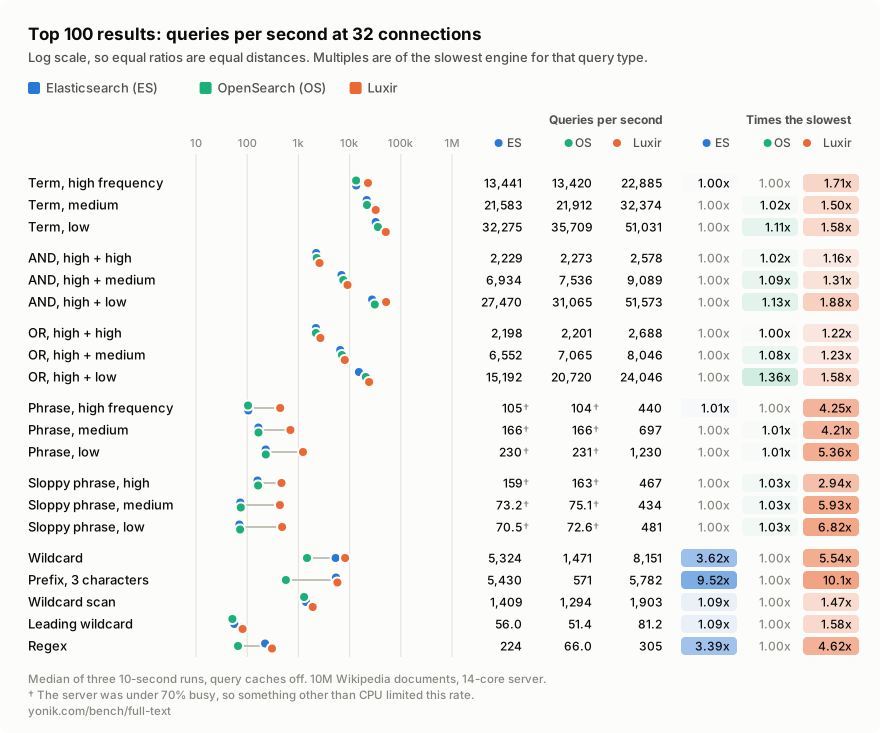
Exact hit counts
Section titled “Exact hit counts”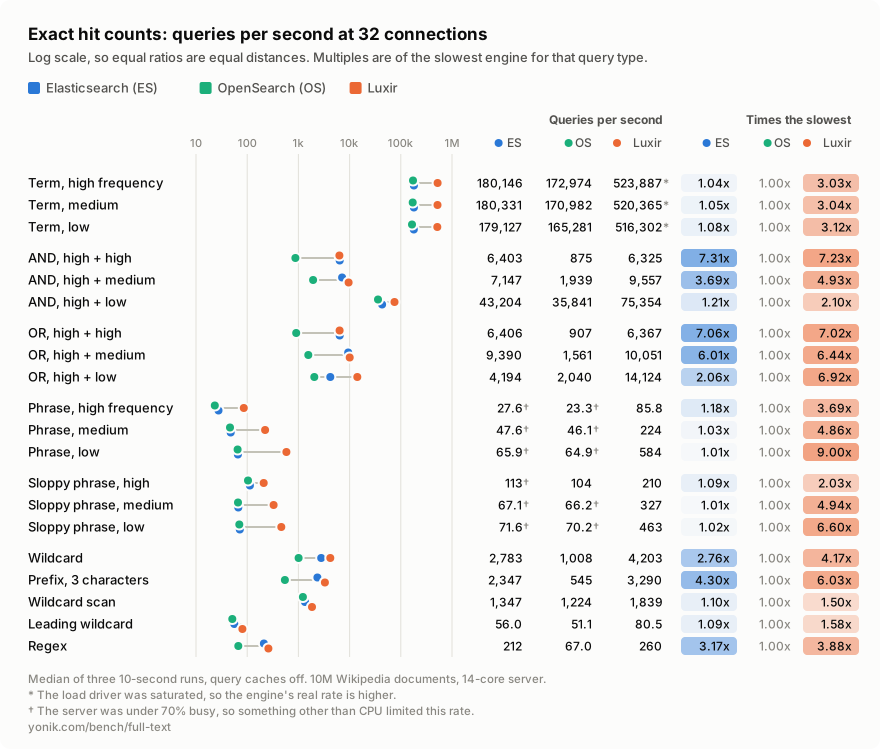
By query family
Section titled “By query family”The range of throughput ratios at 32 connections, across the three term-frequency bands and across top 10, top 100, and exact count:
| Query family | Luxir vs Elasticsearch | Luxir vs OpenSearch | Elasticsearch vs OpenSearch |
|---|---|---|---|
| Term | 1.50×–2.90× | 1.40×–3.10× | 0.90×–1.08× |
| AND | 0.99×–2.20× | 1.10×–7.20× | 0.83×–7.30× |
| OR | 0.99×–3.40× | 1.10×–7.00× | 0.55×–7.10× |
| Phrase | 3.10×–8.90× | 3.30×–9.00× | 0.96×–1.18× |
| Sloppy phrase | 1.90×–7.60× | 2.00×–7.50× | 0.92×–1.09× |
| Wildcard, prefix, regex | 1.02×–1.50× | 1.50×–10.10× | 1.09×–9.80× |
The phrase and sloppy phrase rows include the reference engines’ stall at 32 connections, described under Scaling with load. At 8 connections, where every engine keeps its connections busy, those two rows are 1.3x to 2.4x and 1.2x to 2.2x against Elasticsearch, and 1.6x to 2.4x and 1.4x to 2.1x against OpenSearch.
What stands out:
- Term queries are steady across term frequencies: 2.3x to 2.5x for the top 10 and 1.4x to 1.7x for the top 100. Counts are 2.9x to 3.1x, and those are lower bounds for Luxir, because at more than 500,000 queries per second it saturated the load driver.
- The smallest margins are exact counts of AND and OR queries over two frequent terms, where Luxir and Elasticsearch tie at about 6,400 queries per second. OpenSearch manages about 900 on the same queries.
- Phrase and sloppy phrase queries are 1.2x to 2.4x with 1 and 8 connections. The 1.9x to 9x at 32 connections is mostly the reference engines’ stall, not query execution.
- Three-character prefix queries for the top 10 are where Luxir scales worst. Its throughput grows only 1.2x from 8 to 32 connections while Elasticsearch’s grows 2.5x, and the margin shrinks from 2.1x to a tie. The server is fully busy, so Luxir is burning CPU there, not waiting: its CPU time per query rises from 1.7 ms with one connection to 4.9 ms.
- OpenSearch scales poorly on wildcard, three-character prefix, and regex queries. From 8 to 32 connections its top-10 throughput grows 1.3x on wildcard and regex and not at all on prefix, where it stays near 575 queries per second while its CPU time per query rises from 7 ms with one connection to 46 ms. Elasticsearch’s lead over it on these queries grows from 1.3x to 2.4x with one connection to 2.8x to 9.8x with 32.
I believe that Luxir and Elasticsearch tie at high AND/OR counts because the queries are relatively expensive, spending most of their time in Lucene, and both Luxir and Lucene have bitset representations for the postings so it comes down to the same optimized work of ANDing or ORing the bitsets and popcounting them. Both engines have SIMD optimizations and have hit maximum speed given the data representation.
Why is OpenSearch so much slower on those same cells? I don’t know, but I’ve verified by hand that the result is correct and repeatable. I think OpenSearch must have some sort of bug with recent Lucene versions. I plan on looking into it later.
Scaling with load
Section titled “Scaling with load”The server had 14 cores and 28 threads. From 1 connection to 32, the geometric mean throughput grew 19x for Luxir, 14x for Elasticsearch, and 12.5x for OpenSearch.
Every engine runs a query on a single thread in this setup, and 32 connections is more than the server’s 28 threads, so all three should be able to keep the server busy. Luxir does, averaging 26.8 of 28 threads. The reference engines do too on 42 of the 60 query types, where they keep 22 to 27 threads busy. On the other 18, which are exactly the phrase and sloppy phrase query types, they do not. Elasticsearch keeps 8 to 17 threads busy and OpenSearch 8 to 22, and on the worst of them a request spends three times as long waiting as it spends computing. About half of those query types lose throughput outright as connections are added: from 8 connections to 32, counting low-frequency phrase matches fell from 97 to 66 queries per second on Elasticsearch and from 92 to 65 on OpenSearch, while Luxir went from 224 to 584.
I have not identified the cause, but I can rule some things out. It is not garbage collection: the JVM logs show Elasticsearch paused for about 0.1% of the time or less in those cells. It is not the load driver, which sat idle. And it is not fetching the hits, because exact counts return no hits and stall the same way. What the 18 query types have in common is that they read term positions.
So the 32-connection multiples for phrase and sloppy phrase queries measure that stall as much as they measure query execution. With 1 and 8 connections every engine keeps its connections busy, and those are the numbers to use for phrase queries.
CPU and memory
Section titled “CPU and memory”Server CPU time per query, as a geometric mean over the 60 query types:
| Connections | Luxir | Elasticsearch | OpenSearch |
|---|---|---|---|
| 1 | 5.0 ms | 8.1 ms | 10.0 ms |
| 8 | 5.0 ms | 8.6 ms | 11.0 ms |
| 32 | 7.1 ms | 11.5 ms | 16.3 ms |
Luxir spends about 60% of the CPU per query that Elasticsearch does and half or less of what OpenSearch does, at every load level, and that accounts for the 1.6x and 2x at 1 and 8 connections. The larger multiples at 32 connections are not more CPU efficiency. They come from the reference engines leaving part of the server idle on phrase queries, described above.
Index size and peak process memory across the whole run:
| Luxir | Elasticsearch | OpenSearch | |
|---|---|---|---|
| Index on disk | 8.9 GiB | 10.7 GiB | 10.7 GiB |
| Peak anonymous memory | 1.3 GiB | 8.9 GiB | 9.2 GiB |
| Peak resident memory | 3.2 GiB | 10.2 GiB | 10.5 GiB |
These are not minimum memory requirements. The JVM engines were given a fixed 8 GiB heap and used it, which says how they were configured and not how little they need. Resident memory includes mapped index files, and the rest of the index sits in the filesystem cache outside any process. The index layouts also differ: the reference engines keep the original document in _source plus a generated internal _id, and Luxir stores the text field. How little memory each engine can serve from is a separate benchmark.
Latency
Section titled “Latency”Each cell ran for three 10-second repetitions, which is too short for SearchBench’s own rule on publishing 99th percentile latency, so none is given here. Median latency with a single connection, which is close to the raw service time of one query:
| Query type, top 10 | Luxir | Elasticsearch | OpenSearch |
|---|---|---|---|
| Term, medium frequency | 0.12 ms | 0.25 ms | 0.27 ms |
| AND, high + high | 5.5 ms | 7.1 ms | 6.5 ms |
| OR, high + high | 5.4 ms | 7.5 ms | 7.4 ms |
| Phrase, high frequency | 5.0 ms | 17.3 ms | 17.0 ms |
| Sloppy phrase, high | 25.1 ms | 36.1 ms | 33.1 ms |
| Wildcard | 2.1 ms | 3.4 ms | 4.5 ms |
How this was measured
Section titled “How this was measured”This is the short version. The full-text benchmark definition in the SearchBench repository, at the tag these numbers were measured with, is authoritative.
Corpus and index
Section titled “Corpus and index”The corpus is the first 10,000,000 documents of the Wikipedia line-document file that Lucene’s own benchmark suite, luceneutil, uses: English Wikipedia from May 2012, split into chunks of at most 1,024 characters, 12.65 GiB as JSON. The text is not tokenized, lowercased, or cleaned beforehand. That is the analyzers’ job.
Elasticsearch and OpenSearch index the text with the Lucene standard analyzer. Luxir uses its Unicode word tokenizer followed by lowercasing, its closest counterpart. The same index also carries string, numeric, and date fields used by other SearchBench tasks, which these queries never touch.
Each engine builds a fresh index on one node with one shard and no replicas, then force-merges it to a single segment. That layout is checked before and after every measured cell.
Engine configuration
Section titled “Engine configuration”Elasticsearch 9.5.4 (Lucene 10.5.1) and OpenSearch 3.8.0 (Lucene 10.5.0) are the official distributions running on their bundled JDKs with a fixed 8 GiB heap. The bundled JDKs are not the same: Elasticsearch ships Oracle’s build of OpenJDK 26.0.2 (26.0.2+10-55) and OpenSearch ships Eclipse Temurin 25.0.4 (25.0.4+7-LTS). Both run the G1 collector, their distributions’ default. Security is disabled on both, Elasticsearch’s machine learning is disabled, and OpenSearch’s concurrent segment search is off, so both reference engines execute a query serially within the shard. Everything not listed is the distribution default. Luxir runs with its on-disk filesystem store instead of the default in-memory one, its query cache set to zero, and logging at warning level. Everything else is its default.
The Luxir binary is not the 0.1.0 download. It is a GCC release build of commit 547d8a1, compiled on the benchmark machine with -march=native. The 0.1.0 packages are compiled in a container for the generic x86-64-v2, v3, and v4 targets.
Query caches are explicitly disabled on all three engines and the REST request caches are off too, so a repeated request is never answered from a cache. Cached-filter workloads are a separate benchmark. The filesystem cache is warm: this is warmed serving, not cold start.
What was done to make Elasticsearch and OpenSearch fast
Section titled “What was done to make Elasticsearch and OpenSearch fast”I want the reference engines at their best, because a win over a badly configured engine tells me nothing. These choices all favor them:
- A single segment. Every index is force-merged down to one segment, normally the fastest layout for Lucene.
- One node, one shard, no replicas. There is no distributed fan-out, no merging of shard results, and no replication work.
- Hits return only the document id, from doc values. Requests set
_source: falseandstored_fields: _none_, and ask foridthroughdocvalue_fields, so the engines never touch stored fields._source: falseis not enough by itself: both engines still read their internal_idfrom stored fields for every hit. An earlier run of this benchmark leftstored_fieldsout, and at 32 connections it held both engines to about 2,200 queries per second on top-100 term queries that now run at 13,000 to 36,000. - Top 10 and top 100 do not ask for a hit count. Requests set
track_total_hits: false, which frees Lucene to skip whole blocks of documents that cannot make the results. The default counts up to 10,000 hits and gives up some of that. - Counts ask for nothing else.
size: 0, no documents, no scores, so the engines can use every counting shortcut they have. - Security and machine learning are off, so no request pays for authentication or TLS.
- A fixed 8 GiB heap on the bundled JDK, far more than these queries need. Garbage collection pauses were about 0.1% of the time or less in the cells I checked, and about 50 GB of RAM was left for the filesystem cache, several times the size of the index.
- Persistent connections over loopback, with no response compression.
- Thirty seconds of unrecorded load at the start of each engine’s session, so the JVM has compiled the search path before the first measurement.
- Every query runs once, untimed, before measurement, and its response is checked, so no query’s first execution is ever timed.
What was not done:
- No thread pool, garbage collector, or JVM settings were tuned beyond the heap size.
- A multi-segment index was not measured in this run.
- Query and request caches are off. That is not in the reference engines’ favor or against it: it is what makes this a measurement of query execution, and it applies to Luxir too.
Queries
Section titled “Queries”The queries come from luceneutil’s wikimedium.10M task file: term, AND, OR, phrase, and sloppy phrase queries (slop 4), each split into high, medium, and low term-frequency bands. Five multi-term query types join them. Wildcard and three-character prefix are luceneutil’s. Wildcard scan (h*band) and leading wildcard (*sband) are derived from its low-frequency terms, and the 18 regex patterns are curated, because luceneutil has no regex task.
That is 940 queries. A query is only used if all three engines return exactly the same hit count for it on this corpus, which leaves 826. The analyzers are close but not identical, and this keeps their differences out of the timed set instead of pretending they do not exist.
Each of the 20 query types runs three ways, for 60 cells. Top 10 and top 100 return only the document id and do not ask for a total hit count, so every engine is free to skip documents that cannot make the results. Exact count returns no documents and requires an exact total.
Load and measurement
Section titled “Load and measurement”Every cell ran at 1, 8, and 32 connections. Each engine’s session starts with 30 seconds of unrecorded load. Then, for each cell, every request is sent once and its complete response checked before anything is timed. After one second of connection warmup come three 10-second repetitions, and the result is the median of the three. The engines ran one after another, Luxir, then Elasticsearch, then OpenSearch, each with the machine to itself: 14 physical cores for the server and 2 for the load driver.
All 540 cells passed the run’s audit with no request errors, and the hit counts agreed for all 826 queries at all three connection counts. The audit also checks that no hit from Elasticsearch or OpenSearch carries an _id. Across the run no core was recorded above 3.35 GHz against the 3.3 GHz pin, and the hottest sensor ran at a median of 74 °C and peaked at 82 °C, under the machine’s 90 °C limit.
What is not equivalent, and other limits
Section titled “What is not equivalent, and other limits”- The engines are not internally identical and the benchmark does not pretend they are. Analyzers are close counterparts. Agreeing on hit counts does not prove identical matching documents, scores, or result order.
- The load is a closed loop over a fixed query sequence. Each connection walks the query list from its own starting point, so at 8 and 32 connections a faster engine can complete a somewhat different mix of queries within a query type than a slower one. The rates are what each engine completed in that loop, not a uniformly weighted throughput.
- The first measured cell still shows some JVM warmup. High-frequency term, top 10, at 1 connection is the first cell each engine runs, and the 30 seconds of unrecorded load before it runs at 32 connections. The reference engines’ first repetition was still their slowest: 2,156, then 2,497 and 2,506 queries per second on Elasticsearch, and 2,202, 2,415, 2,444 on OpenSearch. The result is the median, so it is unaffected. Luxir’s three repetitions were within 0.4% of each other.
- The slowest single-connection cells got through their query list only a few times in 10 seconds, and some not even once. A fixed-work rerun of those 11 cells, every query exactly once, kept Luxir ahead in all of them by smaller margins, for example 1.12x instead of 1.22x against Elasticsearch on high-frequency phrase counts.
- The Luxir measured is a local build, not the released binary. Same query code as 0.1.0, but a different compiler target, as described under Engine configuration.
- One corpus, one segment, one machine, one engine order, warmed, caches off. This says nothing about multi-segment indexes, cold starts, relevance, or indexing.
Reproduce these results
Section titled “Reproduce these results”From a checkout of SearchBench at fulltext-munin-host-20260920, with the CPU set up as on the hardware page.
SearchBench needs a Luxir binary, and which one you bring affects the numbers. Either download the build for the highest CPU tier your machine supports and point LUXIR_BIN at it, or build Luxir from source with its default gcc-release preset, which compiles with -march=native and is what these results used. /lib64/ld-linux-x86-64.so.2 --help lists the tiers a machine supports, and on this hardware the highest is x86-64-v4. The x86-64-v2 build runs everywhere but gives up the most speed, so it is the wrong one to benchmark on a newer CPU. SearchBench finds a source build in a sibling ../luxir checkout without being told.
export LUXIR_BIN=/path/to/luxir   # not needed for a source build in ../luxirscripts/setup.sh --references
export SERVER_CORES=0-13,16-29 CLIENT_CORES=14-15,30-31export SEARCHBENCH_QUERY_CACHE=offexport BASELINE_ENGINES='luxir elasticsearch opensearch'export BASELINE_VARIANTS='concurrency=1 concurrency=8 concurrency=32,threads=4'export BASELINE_DURATION=10 BASELINE_REPETITIONS=3 BASELINE_LANE=exact BASELINE_WARMUP_SECONDS=30export BASELINE_TASKS="$(PYTHONPATH=python python3 -c 'from presets import FULL_TEXT_TASKS; print(" ".join(FULL_TEXT_TASKS))')"scripts/run-baseline.sh
Revision history
Section titled “Revision history”- 2026-09-21: First publication. Elasticsearch 9.5.4, OpenSearch 3.8.0, run of 2026-09-20, SearchBench tag
fulltext-munin-host-20260920, raw results. Luxir commit547d8a1, a pre-release build of 0.1.0.