
Elasticsearch vs OpenSearch: Full-Text Search Benchmarks
Elasticsearch 9.5.4 and OpenSearch 3.8.0 are close on single-term queries in this benchmark, but their performance diverges sharply on some boolean and multi-term queries. At 32 client connections, Elasticsearch counts matches for an AND or OR of two frequent terms about seven times as fast as OpenSearch. It answers three-character prefix queries for the top 10 results about ten times as fast. OpenSearch goes the other way on an OR of a frequent and a rare term, returning the top 10 about 1.8 times as fast as Elasticsearch.
Both engines use Apache Lucene, with nearly the same Lucene version in these releases. That makes the differences worth examining by query type. A single average misses both the large gaps and the cases where OpenSearch is ahead.
These measurements are part of a full comparison including Luxir, the search engine I develop. This page focuses on Elasticsearch and OpenSearch, using the same requests and results from that run.
| Results as of | 2026-09-20 |
| Elasticsearch | 9.5.4, Lucene 10.5.1, official distribution, bundled JDK (OpenJDK 26.0.2), 8 GiB heap |
| OpenSearch | 3.8.0, Lucene 10.5.0, official distribution, bundled JDK (Eclipse Temurin 25.0.4), 8 GiB heap |
| Corpus | 10 million Wikipedia documents; one node, one shard, one segment, no replicas |
| Hardware | munin: AMD Ryzen 9 9955HX, 64 GB RAM, NVMe. 14 physical cores for the server, 2 for the load driver |
| Caches | Query caches and request caches off; filesystem cache warm |
| SearchBench | Source at fulltext-munin-host-20260920 |
| Raw results | Release fulltext-munin-host-20260920: the JSON for every measured cell and the generated report, with a SHA-256 checksum |
| Full details | Complete report: every measured cell, engine settings, and sample requests and responses |
Where the engines differ
Section titled “Where the engines differ”The table shows the range of Elasticsearch QPS divided by OpenSearch QPS in each family, across term-frequency bands and top 10, top 100, and exact-count requests. Above 1 means Elasticsearch is faster; below 1 means OpenSearch is faster. These are ranges across query types, not confidence intervals.
| Query family | 1 connection | 8 connections | 32 connections |
|---|---|---|---|
| Term | 0.90×–1.09× | 0.89×–1.10× | 0.90×–1.08× |
| AND | 0.82×–6.49× | 0.80×–7.03× | 0.83×–7.31× |
| OR | 0.51×–6.57× | 0.52×–6.81× | 0.55×–7.06× |
| Phrase | 0.96×–1.41× | 0.96×–1.37× | 0.96×–1.18× |
| Sloppy phrase | 0.89×–1.37× | 0.89×–1.38× | 0.92×–1.09× |
| Wildcard, prefix, regex | 1.06×–2.38× | 1.07×–3.87× | 1.09×–9.80× |
The phrase rows at 32 connections include a shared scaling problem: both engines leave much of the server idle. The scaling section describes it. Close ratios in those rows do not mean either engine is using the machine well.
Exact counts favor Elasticsearch
Section titled “Exact counts favor Elasticsearch”For an AND of two high-frequency terms, Elasticsearch handles 6,403 exact-count requests per second at 32 connections, against OpenSearch’s 875. For an OR of two high-frequency terms, the rates are 6,406 and 907. The gap is already about 6.5 times with one connection, so it does not arise only when many queries run concurrently.
Update, 2026-09-23: this gap is caused by bugs in OpenSearch’s query cancellation, and a fix has been submitted upstream; the follow-up post has the diagnosis. The numbers on this page remain those of the 3.8.0 release.
The requested result matters. A count visits enough of the matches to produce an exact total. A top-10 request can skip work once it has competitive results, and in this benchmark it does not also request a hit count. The count result therefore says little about which engine will win when the same terms are used to retrieve the best documents.
OpenSearch wins some top-10 queries
Section titled “OpenSearch wins some top-10 queries”On an OR of a high-frequency and a low-frequency term, OpenSearch returns the top 10 at 44,677 queries per second, against Elasticsearch’s 24,680, at 32 connections. OpenSearch is about 1.9 times as fast at both 1 and 8 connections, too.
OpenSearch also leads on the corresponding AND query: 47,069 against 39,037 queries per second at 32 connections. These cases are a reason to keep the query families and requested result sizes separate when comparing the engines.
Prefix and wildcard gaps grow with load
Section titled “Prefix and wildcard gaps grow with load”For three-character prefix queries returning the top 10, Elasticsearch’s lead grows from 2.0 times with one connection, to 3.9 times with 8, to 9.8 times with 32. The last step comes mostly from OpenSearch ceasing to scale:
| Query, top 10 | Elasticsearch, 8 connections | Elasticsearch, 32 connections | OpenSearch, 8 connections | OpenSearch, 32 connections |
|---|---|---|---|---|
| Three-character prefix | 2,279 | 5,624 | 590 | 574 |
| Wildcard | 2,090 | 5,494 | 1,174 | 1,480 |
| Regex | 95.7 | 223.2 | 53.7 | 67.2 |
All values are queries per second. Unlike the phrase queries discussed below, these queries keep the server busy at 32 connections. OpenSearch’s extra concurrency consumes CPU without a corresponding increase in completed queries. Update, 2026-09-23: most of this gap comes from the same OpenSearch query-cancellation bugs described in the follow-up post; a smaller, load-dependent difference remains after the fix.
Scaling with load
Section titled “Scaling with load”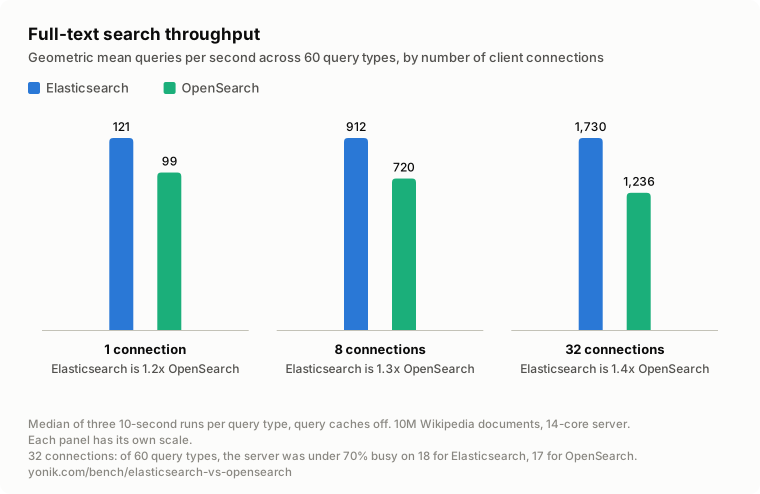
As a geometric mean across the 60 query types, Elasticsearch’s throughput is 22% higher with one connection, 27% higher with 8, and 40% higher with 32. The ratio of these geometric means is the geometric mean of the per-type ratios. It gives every query type equal weight in that calculation; it is not the throughput of a real query mix. SearchBench keeps the underlying types separate, and I have combined them here only for this summary.
The server has 28 hardware threads available to the engine. On the 18 phrase and sloppy phrase types, both engines average only about 12 busy threads at 32 connections. Some of these queries actually lose throughput as concurrency increases. Counting a low-frequency phrase falls from 97 to 66 queries per second on Elasticsearch and from 92 to 65 on OpenSearch between 8 and 32 connections.
The cause is still unresolved. What the affected query types have in common is that they read term positions. The affected requests include exact counts, which fetch no documents. The load driver has spare CPU, and the Elasticsearch garbage collection pauses I checked are too short to explain its lost time. Luxir keeps scaling on these same queries, on the same machine with the same driver, which points away from the hardware and the harness; the full comparison’s scaling section has the details for each engine. The phrase results at 1 and 8 connections are more useful for comparing query execution without that shared scaling problem.
Results for all 60 query types
Section titled “Results for all 60 query types”These charts show every query type at 32 connections. Each dot is an engine’s queries per second on a log scale, so equal ratios have equal distances. The numeric columns give the rates and each engine’s multiple of the slower engine for that row. A dagger marks a cell where the server was under 70% busy. Results at 1 and 8 connections are also in the complete report.
Top 10 results
Section titled “Top 10 results”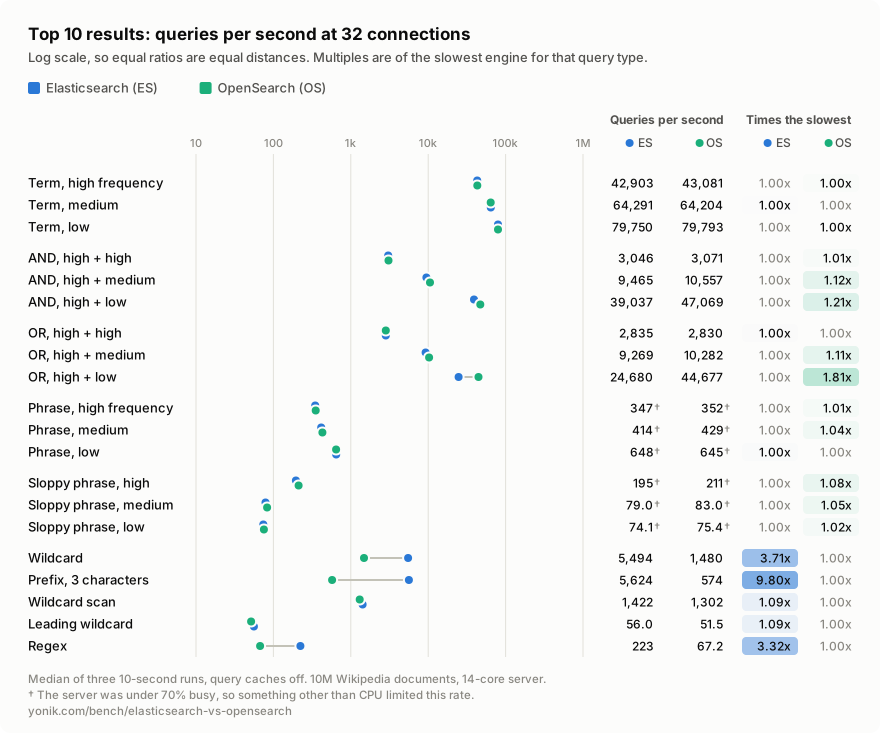
Top 100 results
Section titled “Top 100 results”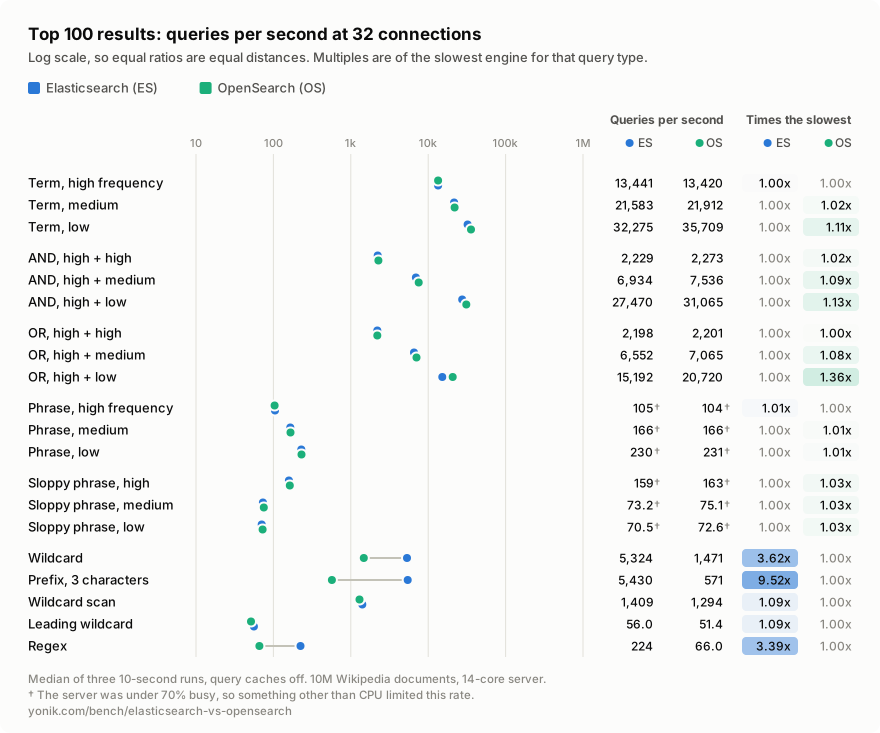
Exact hit counts
Section titled “Exact hit counts”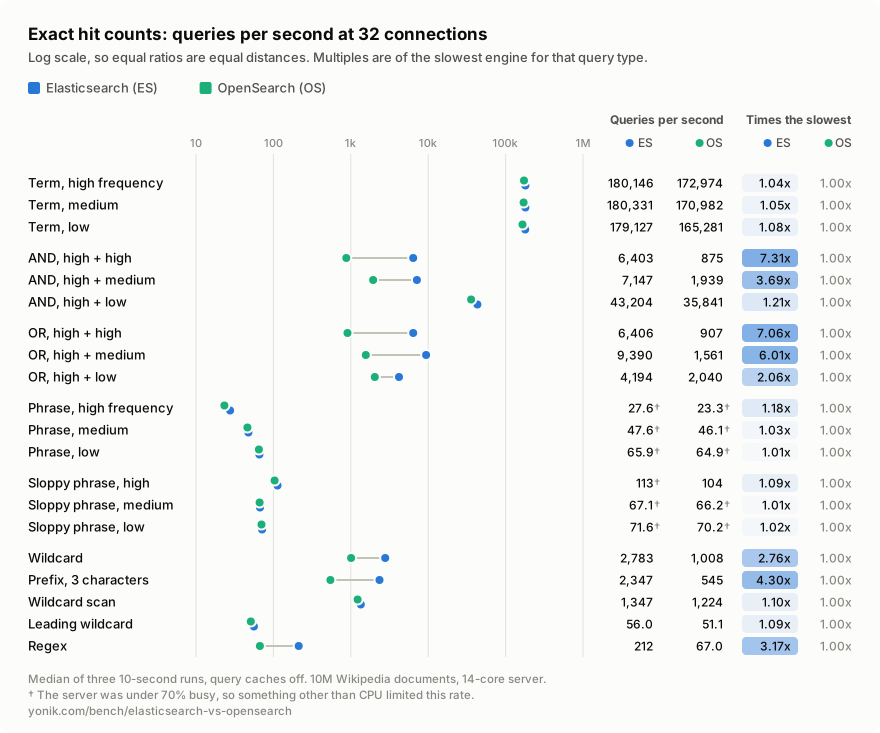
How this was measured
Section titled “How this was measured”Corpus and index
Section titled “Corpus and index”The corpus is the first 10 million documents of the Wikipedia line-document file used by Lucene’s luceneutil benchmarks: English Wikipedia from May 2012, split into chunks of at most 1,024 characters. Both engines index the original text with the Lucene standard analyzer. The index also has string, numeric, and date fields used by other SearchBench tasks; these queries do not use them.
Both engines serve one shard on one node, with no replicas, force-merged to one segment. Segment topology is checked before and after each measured cell. The machine has 64 GB of RAM, a warm filesystem cache, and a CPU frequency pinned to 3.3 GHz. See the hardware page for the full configuration.
Engine settings and requests
Section titled “Engine settings and requests”The engines are their official distributions with bundled JDKs and fixed 8 GiB heaps. The bundled JDKs are not the same: Elasticsearch ships Oracle’s build of OpenJDK 26.0.2 (26.0.2+10-55) and OpenSearch ships Eclipse Temurin 25.0.4 (25.0.4+7-LTS). Both run the G1 collector, their distributions’ default. Security is off on both, Elasticsearch’s machine learning is off, and OpenSearch’s concurrent segment search is off. Query and request caches are disabled so repeated requests measure query execution.
Top-10 and top-100 requests set _source: false, stored_fields: _none_, docvalue_fields: ["id"], and track_total_hits: false. They retrieve document IDs from doc values and do not load stored fields or compute a hit count. Count requests use size: 0 and request an exact total. These choices are significant: returning stored documents or computing exact counts alongside the top results would measure different work. The full comparison lists everything that was done to make both engines fast and what was left untuned. One item there is worth knowing if you run either engine: _source: false is not enough to keep a request away from stored fields, and leaving out stored_fields: _none_ cost both engines most of their throughput on top-100 term queries in an earlier run.
The load driver uses persistent HTTP connections over loopback, without response compression. It gets two physical cores of its own; the server gets the other 14. Each engine has the machine to itself while it is measured.
Queries and timing
Section titled “Queries and timing”Term, AND, OR, phrase, and sloppy phrase queries come from luceneutil’s wikimedium.10M task file, split by term frequency. Sloppy phrases use slop 4. Wildcard and three-character prefix queries also come from luceneutil; wildcard-scan and leading-wildcard patterns are derived from its low-frequency terms, and 18 regex patterns are curated.
The run uses 826 of the 940 candidate queries. Selection required identical hit counts across all three engines in the full comparison, so this is the shared query set from that run, not a separate selection for this pair. Matching counts do not establish identical matching documents, scores, or rankings.
Each of the 20 query types runs as top 10, top 100, and exact count, at 1, 8, and 32 connections. Every engine session starts with 30 seconds of unrecorded load. Every query is executed and its response validated before timing, followed by one second of connection warmup and three 10-second repetitions per cell. The charts report the median of the three repetition rates. Elasticsearch runs before OpenSearch in the campaign. All 360 cells for these two engines passed the run’s audit without request errors.
Limits
Section titled “Limits”- This is warmed query serving on one corpus and one segment, with query caches off. It does not measure indexing, relevance, aggregations, cold starts, cached queries, distributed search, or other segment layouts.
- The driver runs a closed loop over fixed query sequences. At higher concurrency, engines can complete different proportions of the individual queries within a type, so the measured rates are not a uniform mix of those queries.
- Some slow types complete their query list only a few times within a repetition, or less than once with a single connection. The first measured cell also retains some JVM warmup effects despite the session warmup.
- Ten-second repetitions do not support SearchBench’s requirements for publishing 99th-percentile latency. No tail-latency claim is made here.
- The 32-connection phrase scaling problem remains unresolved. The count and prefix gaps were explained after this run; see the update notes above.
The benchmark definition at the measured tag, complete report, and reproduction commands provide the details behind these results. The full comparison adds Luxir to the same measurements.
Revision history
Section titled “Revision history”- 2026-09-23: Added update notes on the cause of the count and prefix gaps, linking the follow-up post. Numbers unchanged.
- 2026-09-21: First publication. Elasticsearch 9.5.4, OpenSearch 3.8.0, run of 2026-09-20, SearchBench tag
fulltext-munin-host-20260920, raw results.