
Three bugs behind OpenSearch's 7x count gap
When I announced Luxir earlier this week, the benchmark pages that came with it got more attention than I expected, and one result on them bothered me. On the Elasticsearch vs OpenSearch page, two engines on nearly the same Lucene version were far apart on the same queries: at 32 connections, Elasticsearch 9.5.4 counted the matches for an AND or OR of two frequent terms about seven times as fast as OpenSearch 3.8.0, and answered three-character prefix queries for the top 10 about ten times as fast. The count gap was already 6.5x with a single connection, so it wasn’t a scaling problem. Something was making every query do more work.
A gap that size between two Lucene engines usually means one of them has tripped over something specific, and I didn’t want my pages painting OpenSearch as much slower than Elasticsearch if the cause was a passing regression in one release, fixed a month later and forgotten. So I went looking, expecting to find something small and transient.
What I found was neither. The cause is three bugs in OpenSearch’s query cancellation: two in the wrapper it puts around Lucene’s index reader so that a cancelled search can stop in the middle of a query, and an older bottleneck in the check itself that the first two had been hiding. The wrapper arrived in OpenSearch 3.7.0, and it hides the bulk postings operations that Lucene has been moving its hot paths onto since 10.2. From that release on, every Lucene optimization built on those operations showed up in Elasticsearch’s numbers and passed OpenSearch by, and each new Lucene widens the gap a little more: the changelog for the next release already lists more of them. The fix is PR 23117 against OpenSearch (issue 23107). With it, OpenSearch counts within a few percent of Elasticsearch, and most of the prefix gap closes too. Here is the whole story in one chart: each fix, before and after, on the queries it targeted, and then all three together against the 3.8.0 release.
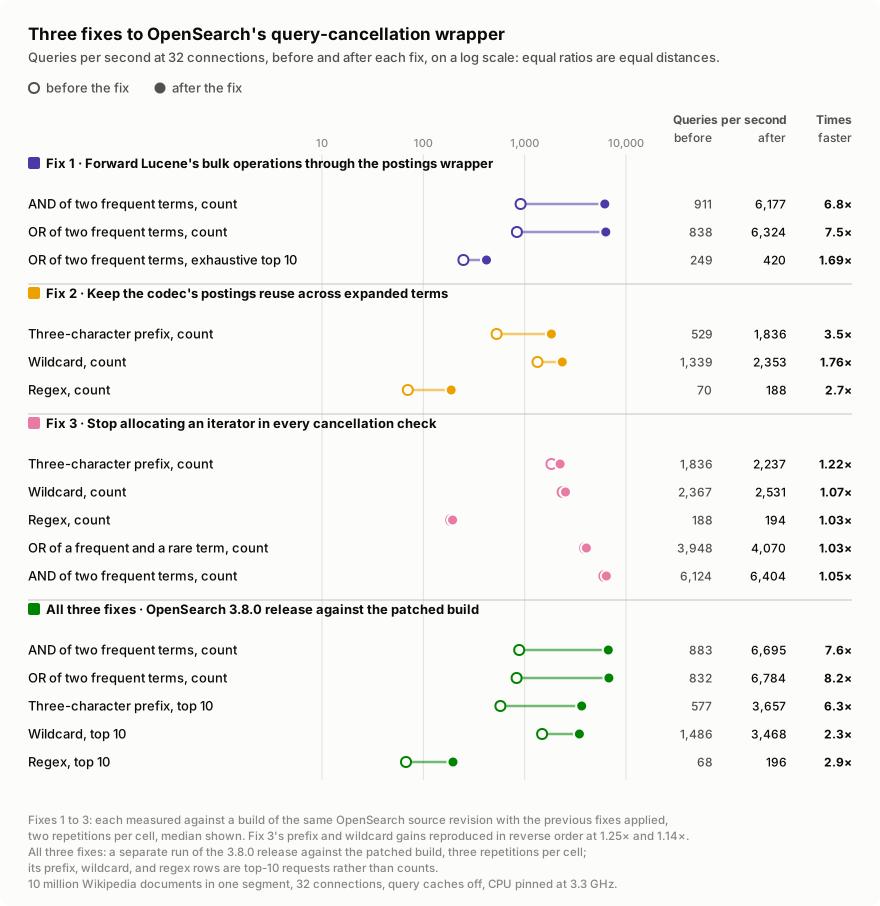
Cancellation stays enabled in every measurement here; the fixes change what a check costs, not whether it happens, and the pull request’s tests exercise cancellation inside the restored bulk paths. The rest of this post is what each bug was, how I found it, and what’s left.
Where the wrapper comes from
Section titled “Where the wrapper comes from”OpenSearch has a search.low_level_cancellation setting, on by default, that lets a cancelled or timed-out search stop while it is still inside Lucene rather than at the next phase boundary.
It works by wrapping the index reader in an “exitable” reader, in the style of Lucene’s own ExitableDirectoryReader, whose terms enumeration checks a cancellation flag every so often, and by wrapping the bulk scorer so that it checks between windows of documents.
In a change merged in May 2026 and shipped in 3.7.0, OpenSearch extended this to every PostingsEnum as well, so that field-data loading, which walks postings outside any bulk scorer, could also be cancelled.
That is a reasonable thing to want. The wrapper it added is where the first two bugs live, which means OpenSearch 3.7.0 and 3.8.0 are affected at their default settings; the third is older, and only became visible once the first two were fixed.
The other half of the story is Lucene. Lucene 10.2 added DocIdSetIterator.intoBitSet, a bulk operation that lets a postings list set a whole window of bits at once instead of being asked for one document at a time, and by 10.5 dense boolean scoring and most constant-score paths run through intoBitSet, docIDRunEnd, and nextPostings.
These are the methods that make the current Lucene fast on exactly the queries where OpenSearch was slow.
Bug 1: the bulk operations disappeared
Section titled “Bug 1: the bulk operations disappeared”OpenSearch’s postings wrapper extends Lucene’s FilterPostingsEnum, which forwards docID, freq, nextDoc, advance, positions, and cost to the wrapped iterator, and nothing else.
intoBitSet, docIDRunEnd, and nextPostings fall through to the base-class defaults, and the default intoBitSet is a loop calling nextDoc() and setting one bit per call.
So every wrapped postings list silently lost the codec’s bulk path wherever Lucene uses it, exhaustive counts and dense boolean scoring most of all, and paid the wrapper’s cancellation-sampling counter on each of those nextDoc() calls as well.
The fix forwards the three methods to the codec, with a cancellation check between bitset windows of at most a million document IDs, matching the bound OpenSearch’s bulk scorer already uses. On its own, against an unmodified build of the same source, at 32 connections:
| Query | Before | After | |
|---|---|---|---|
| AND of two frequent terms, count | 911 | 6,177 | 6.8x |
| OR of two frequent terms, count | 838 | 6,324 | 7.6x |
| OR, exhaustive top 10 | 249 | 420 | 1.7x |
Queries per second; a 10 million document Wikipedia index in one segment, query caches off, fixed CPU frequency.
That was the count gap. Large gaps remained on the multi-term queries, though: wildcard counts gained 44%, but prefix and regex did not move at all, and they had their own 4x to 10x gap on the benchmark page.
Bug 2: postings reuse thrown away
Section titled “Bug 2: postings reuse thrown away”A prefix, wildcard, or regex query expands to many terms, and Lucene visits their postings one term after another.
To avoid allocating a fresh decoder for each one, the terms enumeration passes the previous PostingsEnum back to the codec as a reuse candidate.
The wrapper’s postings(reuse, flags) called the codec with null instead, every time, because the wrapper type didn’t match the codec’s type and nobody unwrapped it.
On a query that touches thousands of terms, that is thousands of buffer and decoder allocations per query, and a profile of prefix queries showed 31% of CPU samples constructing codec postings objects.
The fix unwraps OpenSearch’s own wrapper, hands the native iterator to the codec, which still decides whether it can reuse it, and puts a fresh wrapper around whatever comes back. With bug 1 already fixed, at 32 connections:
| Query | Before | After | |
|---|---|---|---|
| Three-character prefix, count | 529 | 1,836 | 3.5x |
| Wildcard, count | 1,339 | 2,353 | 1.8x |
| Regex, count | 70 | 188 | 2.7x |
Bug 3: the cancellation check itself
Section titled “Bug 3: the cancellation check itself”That closed most of the prefix gap, but not as much as I expected: prefix counts sat at about 1,840 queries per second against Elasticsearch’s roughly 2,390 on the same hardware and protocol.
So I profiled again. About 20% of CPU samples were now inside the cancellation check, and most of those were in a HashSet iterator.
OpenSearch keeps the per-search cancellation callbacks in a HashSet<Runnable> and iterates it on every check. This one is older than the wrapper; it was invisible until the first two fixes removed the work around it.
There are one or two callbacks, but the check runs every 16 terms during enumeration, every 8,192 postings, and between every bulk-scoring window, on every one of 28 threads, and each call allocated a fresh iterator.
Once the first two bugs stopped hiding it, that allocation was a visible fraction of a prefix query.
The fix is an ArrayList with an indexed loop; duplicate rejection, removal, and cleanup behave as before, and no check was removed or made less frequent.
With bugs 1 and 2 already fixed, at 32 connections:
| Query | Before | After | |
|---|---|---|---|
| Three-character prefix, count | 1,836 | 2,237 | 1.22x |
| Wildcard, count | 2,367 | 2,531 | 1.07x |
| Regex, count | 188 | 194 | 1.03x |
| AND of two frequent terms, count | 6,124 | 6,404 | 1.05x |
Repeating the prefix and wildcard cells in the opposite order with fresh JVMs gave 1.25x and 1.14x, so those two gains are solid; the smaller ones did not get an independent recheck. The iterator hotspot is gone from the profile, and the cancellation check’s share of samples fell from about 20% to about 6%.
What’s left
Section titled “What’s left”Measured the way the benchmark page measures, the patched build’s counts of two frequent terms are within about 3% of Elasticsearch’s at 32 connections. On prefix and wildcard top-10 queries it matches Elasticsearch within 5% with a single connection and trails by about 1.6x at 32; that remaining cost grows with load, is specific to OpenSearch’s multi-term path, and is not something I have identified. OpenSearch keeps its lead on the query family where it was already ahead.
If you run OpenSearch
Section titled “If you run OpenSearch”The bugs are in 3.7.0 and 3.8.0 with default settings, and they cost the most on exact counts of frequent-term boolean queries and on prefix, wildcard, and regex queries. The pull request is under review as I write this; if it is merged, the fix will ship in a later release.
Method
Section titled “Method”Everything here was measured on the same machine and index as the benchmark page, with SearchBench at the commit the page’s results record. The incremental tables come from the pull request’s A/B campaigns, which compare builds of the same OpenSearch source revision that differ only in the server jar, with two repetitions per cell. The chart’s last panel and the paragraph above come from a separate run with the page’s protocol, three 10-second repetitions per cell against the 3.8.0 release. That run compares complete builds rather than isolating the patch:
| Build | OpenSearch | Lucene | JDK |
|---|---|---|---|
| Stock | 3.8.0 official distribution | 10.5.0 | bundled Temurin 25.0.4 |
| Patched | 3.10.0 snapshot with the pull request’s code | 10.5.1 | OpenJDK 25.0.4.1 |
| Elasticsearch | 9.5.4 official distribution | 10.5.1 | bundled OpenJDK 26.0.2 |
Query caches were off throughout so that repeated queries measure execution; the exact requests, and what was done to make both engines fast, are described on the full comparison.
The Elasticsearch vs OpenSearch page keeps the 3.8.0 numbers, because that is what the release does; it now carries a note pointing here.