
Elasticsearch vs OpenSearch: Faceted Search Benchmarks (String Fields)
Which of Elasticsearch and OpenSearch is faster at faceted search depends on how many distinct values the faceted field has. Asked for the top 10 values of a string field over a 10 million document index, OpenSearch is faster on fields with few values: 1.14 to 1.48 times on a field with 10 values, and on a field with 1,000 values from 1.24 times with a filter matching 99% of the documents to 22.5 times with no filter. Elasticsearch is faster on the fields with 1.6 and 2.0 million values, by up to 1.24 times. On the fields in between, the lead changes hands from cell to cell, by up to 1.22 times.
Each engine also differs from itself from one launch to the next. Both have groups of cells that run nearly 2x slower in some launches than in others, with the same build, index, and requests. In 19 of the 42 cells, which engine is faster depends on which launch of each you compare.
These measurements are part of a full comparison including Luxir, the search engine I develop. This page focuses on Elasticsearch and OpenSearch, using the same requests and results from that run.
| Results as of | 2026-10-12 |
| Elasticsearch | 9.6.0-SNAPSHOT, Elastic’s official snapshot build of main at 85ae79bde (built 2026-10-09), Lucene 10.5.1, bundled JDK (OpenJDK 27), 8 GiB heap |
| OpenSearch | 3.10.0 nightly build 12272, the official CI build of main at d016718b1 (built 2026-10-10), Lucene 10.5.1, bundled JDK (Eclipse Temurin 25.0.4.1), 8 GiB heap |
| Corpus | 10 million documents with synthetic string fields; one node, one shard, one segment, no replicas |
| Hardware | munin: AMD Ryzen 9 9955HX, 64 GB RAM, NVMe. 8 cores for the server, 8 for the load driver |
| Caches | Request caches off. Filter caching on, at each engine’s defaults |
| Launches | Six launches of each engine. Every number is that engine’s fastest launch for the cell |
| SearchBench | Source at facet-grid-munin-isolated-20261012 |
| Raw results | Release facet-grid-munin-isolated-20261012: every cell, memory timeline, and run context from all six launches of each engine, with a SHA-256 checksum |
Both builds are unreleased official builds from the same week. The OpenSearch build includes the fix for the query-cancellation bugs that slowed some of its full-text queries.
Where the engines differ
Section titled “Where the engines differ”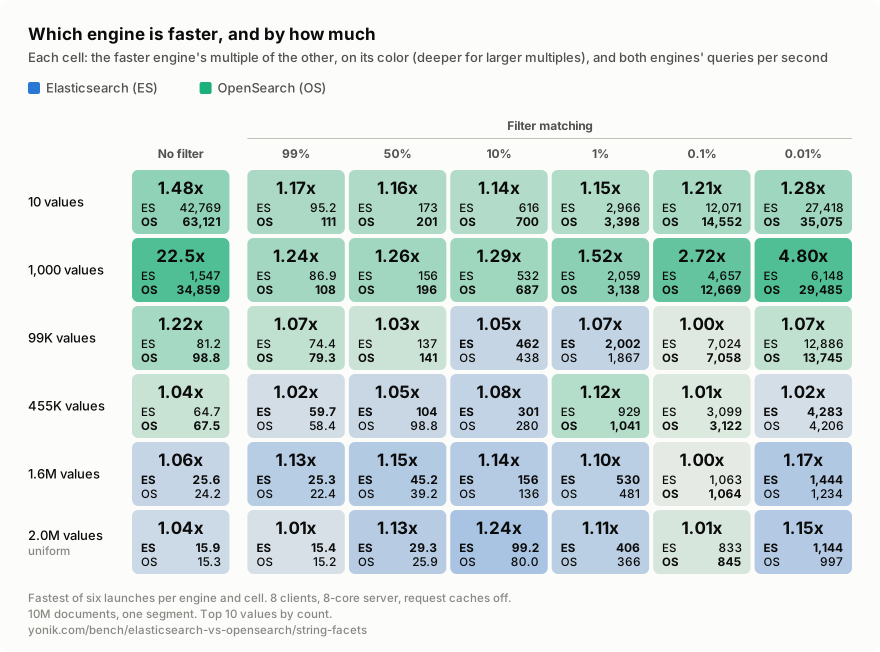
Elasticsearch is faster in 18 cells and OpenSearch in 24. Comparing each engine’s median launch instead of its fastest changes the winner in three cells, all within 11%.
OpenSearch is faster on fields with few values
Section titled “OpenSearch is faster on fields with few values”On the 10-value field OpenSearch is ahead in every cell, by 1.14 to 1.48 times. On the 1,000-value field it is 1.24 to 1.52 times as fast with filters matching 99% to 1% of the documents, and the gap widens from there:
| 1,000-value field | Elasticsearch | OpenSearch |
|---|---|---|
| 0.1% filter | 4,657 QPS, 1.7 ms CPU | 12,669 QPS, 0.63 ms CPU |
| 0.01% filter | 6,148 QPS, 1.3 ms CPU | 29,485 QPS, 0.27 ms CPU |
| No filter | 1,547 QPS, 6.3 ms CPU | 34,859 QPS, 0.23 ms CPU |
CPU is server CPU time per request. With those two selective filters, Elasticsearch is slower on the 1,000-value field than on the 99,000-value one, which OpenSearch is not. Without a filter, OpenSearch’s 0.23 ms per request on the 1,000-value field is about 300 times less than the same facet costs it with the 99% filter, so it is not visiting the 10 million documents. Elasticsearch’s 6.3 ms is 14 times less than its 99% cost, and 35 times its cost on the 10-value field.
Elasticsearch is faster on fields with the most values
Section titled “Elasticsearch is faster on fields with the most values”On the fields with 1.6 and 2.0 million values, Elasticsearch is ahead in every cell except the 0.1% filter, where the two are within 2%. Its largest lead is 1.24 times, at 10% on the uniform field. Both engines slow down sharply as the number of values grows: with a filter matching 99% of the documents, each manages about 15 queries per second on the 2.0M-value field, against about 100 on the 10-value field. Without a filter, from 99,000 values up, both run at 15 to 99 queries per second, about as slowly as with the 99% filter.
Run-to-run variation
Section titled “Run-to-run variation”Each engine was launched six times on the same index. The spread from slowest to fastest launch was 12.7% of the median in Elasticsearch’s typical cell and 50.6% in its worst. For OpenSearch it was 11.1% and 52.3%.
A slow launch stays slow through its whole run on a particular group of cells, with more CPU per request, while its other cells run normally. Three examples, with each engine’s QPS in its six launches, in order:
| Cell | Engine | 1 | 2 | 3 | 4 | 5 | 6 |
|---|---|---|---|---|---|---|---|
| 99% filter, 2.0M values | Elasticsearch | 14.5 | 15.1 | 14.6 | 14.2 | 13.5 | 15.4 |
| OpenSearch | 14.6 | 8.6 | 15.2 | 14.6 | 14.7 | 7.5 | |
| 99% filter, 1,000 values | Elasticsearch | 46.5 | 86.9 | 74.3 | 85.3 | 78.2 | 82.8 |
| OpenSearch | 107.8 | 108.2 | 105.2 | 97.6 | 106.7 | 95.7 | |
| 0.1% filter, 10 values | Elasticsearch | 9,736 | 11,044 | 12,071 | 11,123 | 7,355 | 11,070 |
| OpenSearch | 14,163 | 14,552 | 14,427 | 13,868 | 14,232 | 13,413 |
On the 2.0M-value field at 99%, the engines tie against OpenSearch’s fast launches, and Elasticsearch is 1.6 to 2 times as fast against its slow ones. On the 1,000-value field, OpenSearch’s lead is 1.1 to 1.5 times against Elasticsearch’s fast launches and 2.1 to 2.3 times against its slow one.
Counting 24 more launches of the same two builds while preparing this run, OpenSearch came up slow on its high-cardinality fields under the denser filters in 15 of 30 launches. Elasticsearch has two main groups: the 10 and 1,000-value fields under the denser filters, slow in 4 of 30, and the 0.1% and 0.01% filters on the fields with up to 99,000 values, slow in 8 of 30. Both have smaller groups too. Relaunching on the same index draws again, so it follows the process, not the data. I have not pinned down the cause.
For anyone comparing the two engines on their own workload: a single launch of each is not enough to call a 10% or 20% difference, and in some cells not a 2x one.
How this was measured
Section titled “How this was measured”Corpus and index
Section titled “Corpus and index”The corpus is SearchBench’s facet corpus: 10,000,000 documents with no text. Each faceted field’s values are drawn at random from a Zipf distribution, or a uniform one for the 2.0M-value field, using a hash of each document’s id and title as the random number, so every run generates the same corpus. The filters are term queries on fields that hold t in 99%, 50%, 10%, 1%, 0.1%, or 0.01% of the documents, and the sets nest, so each row is the same query narrowed further. The full comparison lists the fields.
Each engine built its own index with the build measured, one shard on one node with no replicas, force-merged to one segment. All six launches of an engine served the same index, and its layout was checked before and after every measured cell. The two indexes are 2.09 GiB (Elasticsearch) and 2.08 GiB (OpenSearch) on disk.
Engine settings and requests
Section titled “Engine settings and requests”The engines are official builds with their bundled JDKs and fixed 8 GiB heaps. The bundled JDKs are not the same: Elasticsearch ships Oracle’s build of OpenJDK 27 (27+35-2325) and OpenSearch ships Eclipse Temurin 25.0.4.1 (25.0.4.1+1-LTS). Both run the G1 collector, their distributions’ default. Security is off on both, Elasticsearch’s machine learning is off, and OpenSearch’s concurrent segment search is off, which keeps its counts exact. The string fields are keyword fields with the default doc values.
Both engines receive the same request body. For the 1% filter on the 2.0M-value field (POST /searchbench_facet/_search?request_cache=false):
{ "query": { "bool": { "must": [ { "match_all": {} } ], "filter": [ { "term": { "sel1_s": { "value": "t" } } } ] } }, "track_total_hits": false, "size": 0, "_source": false, "docvalue_fields": [ "id" ], "aggs": { "facet": { "terms": { "field": "catu2m_s", "size": 10, "shard_size": 10, "show_term_doc_count_error": true } } }}No documents and no hit count are requested, and shard_size equal to size keeps the single shard from collecting more values than it returns. With one shard the counts are exact either way; both engines reported a count error of 0, and returned the same totals and the same top 10 values, with the same counts in the same order, in all 42 cells. The full comparison lists everything that was done to make both engines fast.
Load and timing
Section titled “Load and timing”The engines ran one at a time, each with the machine to itself and its clocks pinned at 3.3 GHz. The server had one of the CPU’s two groups of 8 cores and the load driver the other. Eight client connections, each with its own replay thread, sent requests in a closed loop over persistent connections without response compression. For each cell, every request was checked once, then 3 seconds of load went unrecorded, then two 1-second repetitions were measured. Both engines kept about 8 threads busy in nearly every cell, so their CPU per request tracks their throughput.
The two engines alternated which went first across the six runs. All 504 of their measured cells completed without a request error.
Limits
Section titled “Limits”- Fastest of six. Every number in the grid is the fastest of an engine’s six launches for that cell. That favors both engines equally, but it hides the slow launches described above. All six launches are in the raw results.
- Short measurements. Two 1-second repetitions per cell are too few samples for tail latency, so none is reported.
- Different JDKs. Each engine runs the JDK it ships with, which is part of what is being compared.
- Synthetic fields, one corpus, one segment, one machine, 8 clients, warmed. This says nothing about multi-segment indexes, more shards, cold starts, or indexing.
- String fields only. Faceting on numeric fields, ranges, dates, nested facets, and metrics per value were not measured here.
Revision history
Section titled “Revision history”- 2026-10-12: First publication. Elasticsearch 9.6.0-SNAPSHOT (
85ae79bde), OpenSearch 3.10.0 nightly 12272 (d016718b1), SearchBench tagfacet-grid-munin-isolated-20261012, raw results.