
Elasticsearch vs OpenSearch vs Luxir: String Faceting Benchmarks
Faceted search counts how many of the documents matching a query carry each value of a field, and returns the most common values, like the brand and category counts beside a product search. Elasticsearch and OpenSearch call it a terms aggregation. This benchmark asks for the top 10 values in 6 different string fields (with different numbers of unique values) on a 10 million document index in conjunction with 7 different filter densities (42 total combinations).
Luxir was faster than both Elasticsearch and OpenSearch in all 42 cells of that grid. With a filter, Luxir throuhput was
- 3.3 to 145 times OpenSearch throughput (median 12x)
- 3.7 to 127 times Elasticsearch throughput (median 14x)
The narrowest margins are where the filter matches a million or more documents and the field has few values. The widest are where few documents match a field with many values: there, Elasticsearch’s and OpenSearch’s cost per request grows with the number of distinct values in the field even when only 942 documents match, and Luxir’s barely does. Without a filter, Luxir answers from its index at about 250,000 queries per second on every field. Elasticsearch and OpenSearch reach tens of thousands of queries per second on the field with 10 values, and OpenSearch on the one with 1,000, but from 99,000 values up they run at 15 to 99, about as slowly as with a filter that matches 99% of the documents.
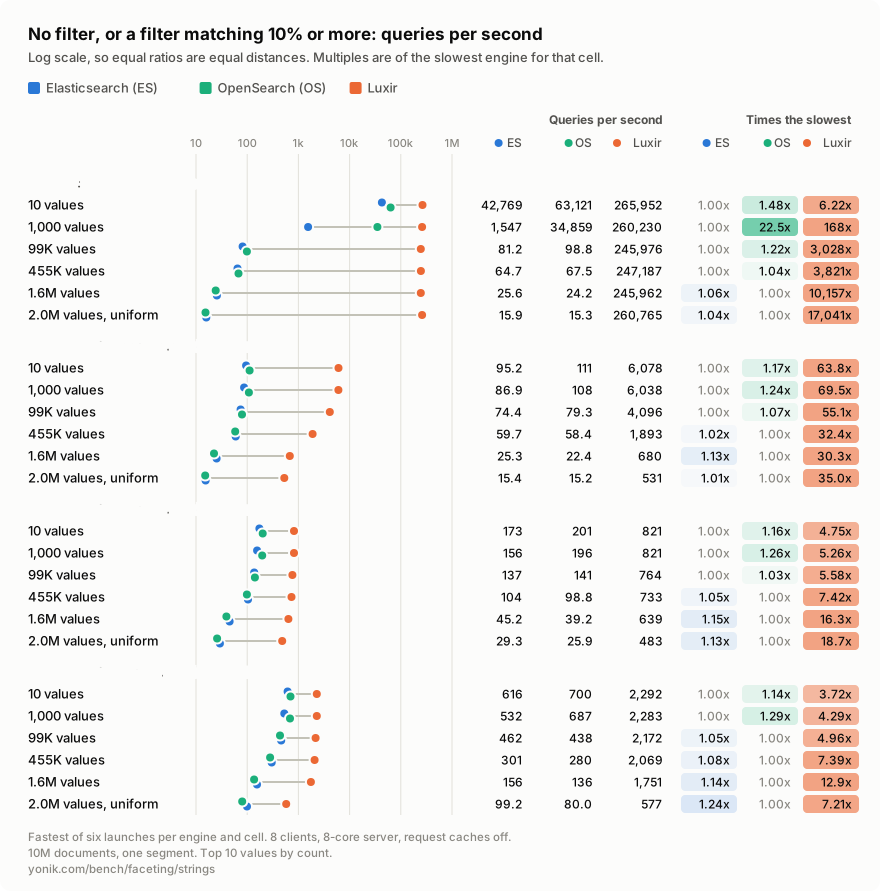
Elasticsearch and OpenSearch, both on Lucene 10.5.1, are within 25% of each other in most cells. Elasticsearch is up to 1.24 times faster on the two fields with the most values. OpenSearch is faster on the fields with 10 and 1,000 values, and far faster on the 1,000-value field with a selective filter or none: 2.7 to 22.5 times. For a closer look at those differences, see Elasticsearch vs OpenSearch: faceted search on string fields.
| Results as of | 2026-10-12 |
| Elasticsearch | 9.6.0-SNAPSHOT, Elastic’s official snapshot build of main at 85ae79bde (built 2026-10-09), bundled JDK (OpenJDK 27), 8 GiB heap |
| OpenSearch | 3.10.0 nightly build 12272, the official CI build of main at d016718b1 (built 2026-10-10), bundled JDK (Eclipse Temurin 25.0.4.1), 8 GiB heap |
| Luxir | Commit 1ef4839 from main, -march=native |
| Hardware | munin: AMD Ryzen 9 9955HX (16 cores, 32 threads), 64 GB RAM, NVMe. 8 cores for the server, 8 for the load driver |
| Caches | Request caches off. Filter caching on, at each engine’s defaults |
| Launches | Six launches of each engine. Every number is that engine’s fastest launch for the cell |
| SearchBench | luxir-search/searchbench, measured at the tag facet-grid-munin-isolated-20261012 on my fork. Luxir’s launches ran at the commit before it, which differs only in a comment |
| Raw results | Release facet-grid-munin-isolated-20261012: every cell, memory timeline, and run context from all six launches of each engine, the grid logs, and the best-of-6 selection, with a SHA-256 checksum |
The two reference engines are unreleased official builds from the same week rather than releases, so that the OpenSearch build includes the query-cancellation fix from Three bugs behind OpenSearch’s 7x count gap.
Summary
Section titled “Summary”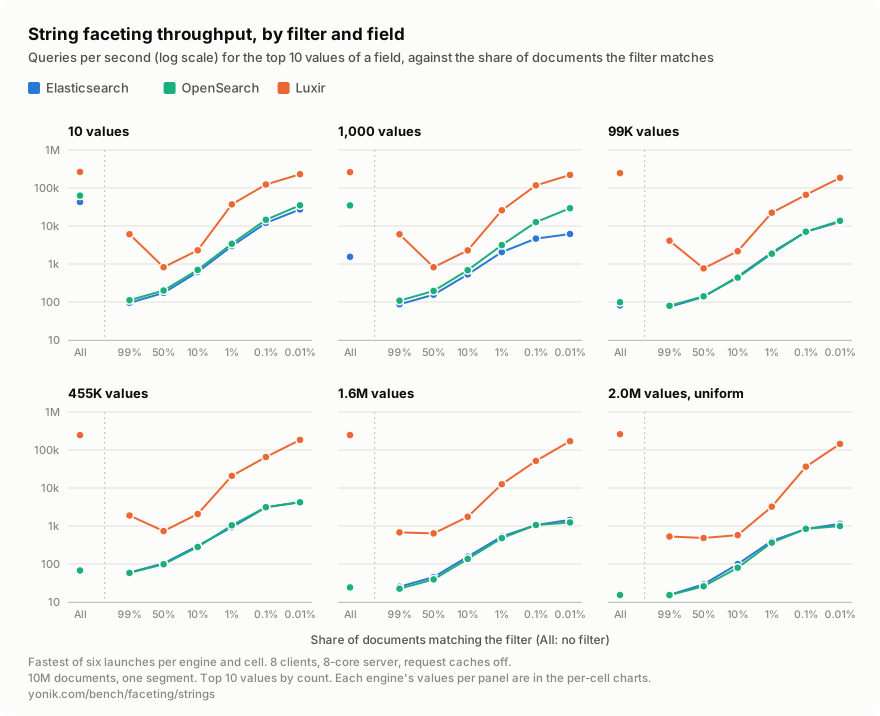
Each panel is one field, and each point is one filter, from none on the left down to one matching 0.01% of the documents on the right. The vertical axis is logarithmic, so the same gap between two engines means the same ratio anywhere on it, and it is shared by all six panels.
Elasticsearch and OpenSearch draw nearly the same curves, rising steadily as the filter matches fewer documents and sinking as the field has more values. Luxir’s curve has a different shape. It is fastest without a filter, slows at 99%, bottoms out at 50%, and then climbs much more steeply than the others as the filter narrows. Its curves also change less from panel to panel: the number of values in the field costs it less.
Results by cell
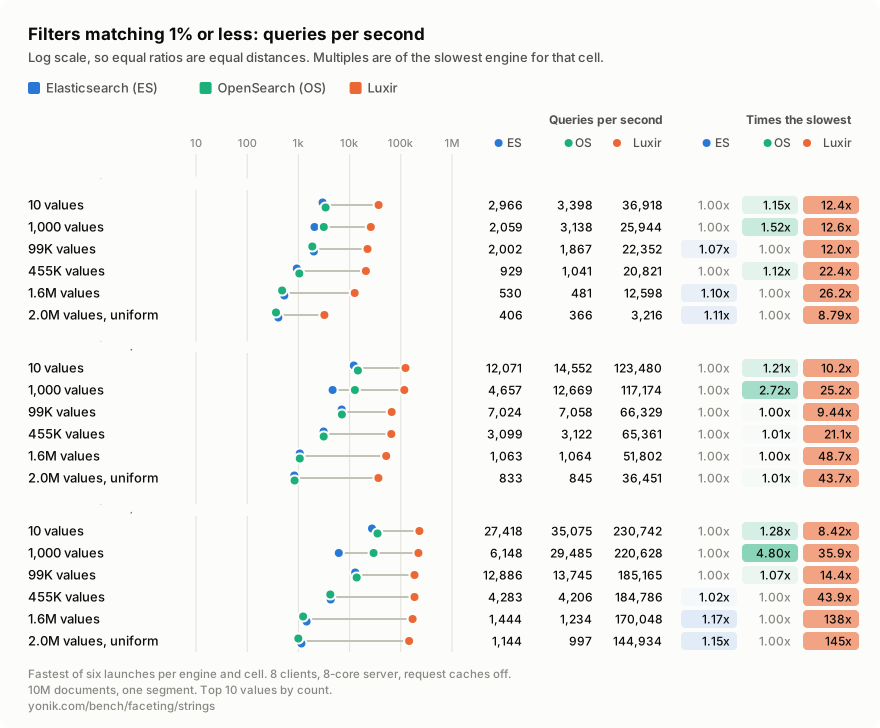
Section titled “Results by cell”Each dot is an engine’s queries per second on a log scale, beside the exact rate and each engine’s multiple of the slowest engine in that cell. Both charts share one axis.
By filter
Section titled “By filter”The range of throughput ratios across the six fields:
| Filter | Luxir vs Elasticsearch | Luxir vs OpenSearch | Elasticsearch vs OpenSearch |
|---|---|---|---|
| None | 6.22×–16,410× | 4.21×–17,041× | 0.04×–1.06× |
| 99% | 26.9×–69.5× | 30.3×–55.8× | 0.80×–1.13× |
| 50% | 4.75×–16.5× | 4.10×–18.7× | 0.79×–1.15× |
| 10% | 3.72×–11.2× | 3.28×–12.9× | 0.77×–1.24× |
| 1% | 7.93×–23.8× | 8.27×–26.2× | 0.66×–1.11× |
| 0.1% | 9.44×–48.7× | 8.49×–48.7× | 0.37×–1.00× |
| 0.01% | 8.42×–127× | 6.58×–145× | 0.21×–1.17× |
What stands out:
- Without a filter, the answer is in the index for Luxir at every field size: 246,000 to 266,000 queries per second, at 0.03 ms of CPU per request. Elasticsearch and OpenSearch are in the same league only on the 10-value field (43,000 and 63,000) and, for OpenSearch, the 1,000-value field (35,000). From 99,000 values up they run at 15 to 99 queries per second, with CPU per request within about a fifth of what the 99% filter costs them. That is where the multiples of 2,500x to 17,000x come from, so I keep this row out of the summary figures above.
- A filter that matches nearly everything is fast for Luxir: 531 to 6,078 queries per second at 99%, 7 times its rate at 50% on the small fields. Elasticsearch and OpenSearch are at their slowest here, 15 to 111 queries per second, so this row has Luxir’s largest margins over large result sets, 27x to 70x.
- The 50% and 10% filters are the closest race. The filters match 1 to 5 million documents, and Luxir’s lead is 3.3x to 5.6x on the fields with up to 99,000 values. It grows with the number of values: at 50%, to 14x to 19x on the two largest fields.
- Selective filters on fields with many values are where Elasticsearch and OpenSearch fall furthest behind. With the 0.01% filter, the same 942 documents match every time, yet their CPU per request rises from 0.2 to 0.3 ms on the 10-value field to 6.9 and 7.9 ms on the 2-million-value field. Luxir’s rises from 0.03 to 0.05 ms. At 1.6 and 2 million values, that is 118x to 145x in throughput.
- Luxir’s weakest field is the uniform one. On the field whose 2 million values are equally likely, its rate at 10% and 1% is 577 and 3,216 queries per second, a third and a quarter of what it manages on the 1.6-million-value field, where Elasticsearch and OpenSearch lose only about a quarter to two fifths. Its lead there is 5.8x to 8.8x, against 11x to 26x on the field next to it.
- Elasticsearch is slow on the 1,000-value field. With the 0.1% and 0.01% filters it is slower there than on the 99,000-value field, which no other engine is, and OpenSearch is 2.7 and 4.8 times faster on it. Without a filter, OpenSearch answers it at 35,000 queries per second and Elasticsearch at 1,500.
Run-to-run variation
Section titled “Run-to-run variation”Luxir’s six launches agreed closely: the spread from slowest to fastest was 1.6% of the median in the typical cell and 6.1% in the worst. For Elasticsearch it was 12.7% and 50.6%, and for OpenSearch 11.1% and 52.3%.
Those larger spreads are not sampling noise. A slow launch stays slow through its whole run on a particular group of cells, with more CPU per request, while the rest of its cells run normally. Which groups a launch lands slow on looks like an independent draw:
| Cell | Engine | QPS in each of six launches | CPU per request |
|---|---|---|---|
| 99% filter, 2.0M values | OpenSearch | 14.6, 8.6, 15.2, 14.6, 14.7, 7.5 | 522 to 544 ms, slow launches 907 to 931 ms |
| 99% filter, 1,000 values | Elasticsearch | 46.5, 86.9, 74.3, 85.3, 78.2, 82.8 | 89 to 101 ms, slow launch 166 ms |
| 99% filter, 2.0M values | Luxir | 531, 516, 518, 523, 508, 527 | 14.9 to 15.4 ms |
OpenSearch’s slow state covers its high-cardinality fields, mostly at the 99% and 50% filters. In 24 more launches of the same two builds while preparing this run, on the same machine, it came up slow there in 13, so 15 of 30 in all. Elasticsearch has two main groups: the 10 and 1,000-value fields under the denser filters, slow in 4 of 30 launches, and the 0.1% and 0.01% filters on the fields with up to 99,000 values, slow in 8 of 30. Both engines have smaller groups too. Relaunching on the same index draws again, so it follows the process, not the data. I have not pinned down the cause.
The charts show each engine’s fastest launch per cell, which is OpenSearch’s fast state. Against its two slow launches, Luxir’s lead at 99% on the 2.0M-value field is 62x and 70x instead of 35x. For an operator, it means a restart can change a node’s capacity on some queries by nearly 2x until the next restart, which is part of what I meant by predictable code generation in Introducing Luxir.
CPU and memory
Section titled “CPU and memory”With eight connections, every engine averaged 7.4 or more of the server’s 16 hardware threads busy in nearly every cell, so CPU time per request mirrors throughput. With a filter, Luxir used 3.7 to 135 times less CPU per request than Elasticsearch, 15 times in the median cell, and 3.3 to 155 times less than OpenSearch, 12.7 times in the median. The exceptions are Luxir’s fastest cells, without a filter and with the 0.01% filter, where it averaged 6.7 to 7.3 threads busy: at 26 to 51 microseconds per request, part of each round trip is spent outside the server. The load driver was never saturated.
Index size and peak process memory across the cells shown:
| Luxir | Elasticsearch | OpenSearch | |
|---|---|---|---|
| Index on disk | 0.62 GiB | 2.09 GiB | 2.08 GiB |
| Peak anonymous memory | 53 MiB | 8.9 GiB | 8.9 GiB |
| Peak resident memory | 232 MiB | 9.0 GiB | 9.1 GiB |
As on the full-text page, these are not minimum requirements. The JVM engines were given a fixed 8 GiB heap and used it, which says how they were configured, not how little they need. Resident memory includes mapped index files. The index layouts differ too: Elasticsearch and OpenSearch keep each original document in _source plus an internal _id, which Luxir does not, and every index carries all of the corpus’s fields, not only the six faceted here.
How this was measured
Section titled “How this was measured”This is the short version. In the SearchBench repository, at the tag these numbers were measured with, the grid is defined by python/presets.py (its rows and columns), python/corpus_transform.py (the corpus), and scripts/grid.sh (the run).
Corpus and index
Section titled “Corpus and index”The corpus is SearchBench’s facet corpus: 10,000,000 documents with no text. Each field’s values are drawn at random from the distribution in the table below. The random numbers come from a hash of each document’s id and title in the Wikipedia file the full-text benchmark uses, so every run generates the same corpus and the fields are independent of each other. The faceted fields:
| Field | Distinct values | Distribution |
|---|---|---|
cat_s |
10 | Zipf, exponent 1.15 |
cat1k_s |
1,000 | Zipf, exponent 1.15 |
cat100k_s |
98,989 | Zipf, exponent 1.15, over 100,000 possible values |
cat1m_s |
454,838 | Zipf, exponent 1.15, over 1,000,000 possible values |
cat5m_s |
1,602,832 | Zipf, exponent 1.0, over 5,000,000 possible values |
catu2m_s |
1,986,583 | Uniform over 2,000,000 possible values |
Values are named in a shuffled order, so a value’s name says nothing about how common it is. The filters are term queries on fields that hold t in 99%, 50%, 10%, 1%, 0.1%, or 0.01% of the documents and f in the rest. The sets nest: every document in the 0.01% set is also in the 0.1% set, and so on up, so each row of the grid is the same query narrowed further.
Each engine built its own index of this corpus with the build measured, on one node with one shard and no replicas, and force-merged it to a single segment. All six launches of an engine served the same index, and its layout was checked before and after every measured cell.
Engine configuration
Section titled “Engine configuration”Elasticsearch 9.6.0-SNAPSHOT and OpenSearch 3.10.0 nightly 12272, both on Lucene 10.5.1, are official builds of each project’s main branch, running on their bundled JDKs with a fixed 8 GiB heap: Oracle’s build of OpenJDK 27 (27+35-2325) for Elasticsearch and Eclipse Temurin 25.0.4.1 (25.0.4.1+1-LTS) for OpenSearch. Both run the G1 collector, their distributions’ default. Security is disabled on both and Elasticsearch’s machine learning is disabled. OpenSearch’s concurrent segment search is off, which keeps its counts exact. The string fields are keyword fields with the default doc values. Everything not listed is the distribution default.
Luxir runs with its on-disk filesystem store instead of the default in-memory one and logging at warning level. Everything else is its default, including its 64 MiB filter cache. It is a GCC release build of commit 1ef4839, compiled on the benchmark machine with -march=native, not a release download.
The same request repeats for the whole cell. The REST request caches, which would return a stored response, are off. Filter caching is on in every engine, at its defaults, and each engine decides for itself what is worth caching.
What was done to make Elasticsearch and OpenSearch fast
Section titled “What was done to make Elasticsearch and OpenSearch fast”- A single segment, on one node and one shard. No merging of per-segment or per-shard results.
- Only the facet is asked for.
size: 0returns no documents, andtrack_total_hits: falseleaves out the total hit count. shard_sizeequalssize. The single shard keeps only the 10 values it returns, instead of the default 25. With one shard the counts are exact either way, and each response’s reported count error, which the harness records, was 0.- Each engine’s fastest launch, cell by cell. Picking the fastest of six launches per cell gave Luxir about 1% over its six-launch median in the typical cell and 2% at most. It gave Elasticsearch 3% typically and up to 9%, and OpenSearch 2% and up to 19%.
- Three seconds of unrecorded load on every cell before measurement. In an earlier check of the unfiltered cells, the slowest to warm, OpenSearch on the 1,000-value field, went from 9,000 to 14,000 to 33,000 to 35,000 queries per second over its first four seconds of load, and then held.
- A fixed 8 GiB heap on the bundled JDK, security and machine learning off, persistent connections over loopback, no response compression.
- Every request was run once and its response checked before anything was timed.
What was not done:
- No thread pool, garbage collector, or JVM settings were tuned beyond the heap size.
- A multi-segment index was not measured.
- The request caches are off. That applies to every engine, and it is what makes this a measurement of faceting instead of a cache lookup.
The request
Section titled “The request”Each cell sends one request over and over. For the 1% filter on the 2.0M-value field, Elasticsearch and OpenSearch receive this (POST /searchbench_facet/_search?request_cache=false):
{ "query": { "bool": { "must": [ { "match_all": {} } ], "filter": [ { "term": { "sel1_s": { "value": "t" } } } ] } }, "track_total_hits": false, "size": 0, "_source": false, "docvalue_fields": [ "id" ], "aggs": { "facet": { "terms": { "field": "catu2m_s", "size": 10, "shard_size": 10, "show_term_doc_count_error": true } } }}and Luxir receives this (POST /collections/searchbench_facet/_search):
{ "query": { "all": true }, "filter": [ { "match": { "field": "sel1_s", "val": "t" } } ], "limit": 0, "fields": [ "id" ], "ops": { "facet": { "field_facet": { "field": "catu2m_s", "limit": 10 } } }}The filterless row drops the filter. Values are ordered by count, then by value, in every engine.
Load and measurement
Section titled “Load and measurement”The engines ran one at a time, each with the machine to itself and its clocks pinned at 3.3 GHz. The server had one of the CPU’s two groups of 8 cores (16 threads) and the load driver the other, so they shared no cache. Eight client connections, each with its own replay thread, sent requests in a closed loop. For each cell, every request was checked once, then 3 seconds of load went unrecorded, then two 1-second repetitions were measured.
Each engine was launched six times. Elasticsearch and OpenSearch alternated which went first, and Luxir’s six launches ran the same day on the same indexes. That is 756 measured cells, all without a request error.
Separately, on these same indexes, the three engines returned the same total and the same top 10 values, with the same counts in the same order, in all 42 cells.
What is not equivalent, and other limits
Section titled “What is not equivalent, and other limits”- The measurements are short. Two 1-second repetitions per cell, so a cell at 15 queries per second completes about 30 requests. Luxir’s six launches agree within a few percent. Elasticsearch’s and OpenSearch’s differ by about 10% in the typical cell, and more where a launch lands in a slow state. That is too few samples for tail latency, so none is reported.
- Fastest of six favors the JVM engines. All six launches of each engine are in the raw results.
- The fields are synthetic. Real data is clustered and correlated in ways independent random draws are not, which can help or hurt any of the engines.
- One corpus, one segment, one machine, 8 clients, warmed. This says nothing about multi-segment indexes, more shards, cold starts, or indexing.
- String fields only. Faceting on numeric fields, ranges, dates, nested facets, and metrics per value were not measured here.
- The Luxir measured is a local build of a commit on main, not a release.
Reproduce these results
Section titled “Reproduce these results”From a checkout of SearchBench at facet-grid-munin-isolated-20261012, with the CPU set up as on the hardware page, and a Luxir binary as described on the full-text page:
export LUXIR_BIN=/path/to/luxir   # not needed for a source build in ../luxirscripts/prepare-corpus.sh facetengines/download.sh opensearch-snapshotengines/download.sh elasticsearch-snapshot
export OPENSEARCH_BUILD=snapshot ELASTICSEARCH_BUILD=snapshotexport SERVER_CORES=0-7,16-23 CLIENT_CORES=8-15,24-31scripts/run-isolated.sh scripts/grid.sh -e luxir,opensearch,elasticsearch -g facet -d 1 -r 2 -x
download.sh installs the newest nightly and snapshot builds, which will not be the ones measured here. The raw results record each build’s download address and checksum, but nightly and snapshot downloads are not kept forever.
Revision history
Section titled “Revision history”- 2026-10-12: First publication. Elasticsearch 9.6.0-SNAPSHOT (
85ae79bde), OpenSearch 3.10.0 nightly 12272 (d016718b1), Luxir commit1ef4839. SearchBench tagfacet-grid-munin-isolated-20261012, raw results.