
Elasticsearch vs OpenSearch: Indexing Benchmarks
In the fastest configuration I found for each, Elasticsearch indexed 10 million documents to one searchable segment sooner than OpenSearch on both corpora. OpenSearch took 2% to 11% longer on Wikipedia full text and 7% to 10% longer on a structured faceting corpus, and used 10% to 16% more server CPU time. Elasticsearch’s lead comes before the force merge: it accepted the documents and made them searchable sooner, and the force merge to one segment that followed took the two engines about the same time.
With each engine’s shipped settings, the order reverses. Elasticsearch took 11% longer than OpenSearch on the facet corpus, 70.4 seconds against 63.5, and 2% longer on full text, inside the spread of the runs. The configuration changes were worth more to Elasticsearch: its shipped settings were 10% and 30% slower than its fastest configuration, against 5% and 9% for OpenSearch.
Elasticsearch’s full-text runs also varied more from run to run, enough that a single run of each engine could put either one ahead.
These measurements are part of a full comparison including Luxir, the search engine I develop. This page focuses on Elasticsearch and OpenSearch, using the same runs.
| Results as of | 2026-11-01 |
| Elasticsearch | 9.7.0-SNAPSHOT, Elastic’s official snapshot build of main at 87a91d32c (built 2026-10-30), Lucene 10.5.2, bundled JDK (OpenJDK 27), 20 GiB heap |
| OpenSearch | 3.10.0 nightly build 12323, the official CI build of main at b86aeacb4 (built 2026-10-31), Lucene 10.5.2, bundled JDK (Eclipse Temurin 25), 20 GiB heap |
| Corpora | 10 million Wikipedia documents (13.6 GB of JSON), and 10 million structured documents for faceting (4.0 GB); one node, one shard, no replicas |
| Hardware | munin: AMD Ryzen 9 9955HX (16 cores, 32 threads), 64 GB RAM. 14 cores for the server, 2 for the feeder |
| Storage | Every index in RAM (tmpfs), so neither engine waits on a disk |
| Runs | Ten runs of each engine at each point, three with shipped settings, each on a freshly started server and an empty index. Every number is the mean |
| SearchBench | luxir-search/searchbench, measured at the tag indexing-munin-20261101 on my fork. The full-text runs used the commit before it, which differs only in the bulk feeder |
| Raw results | Release indexing-munin-20261101: every run’s record, including the configurations tried and the runs superseded, the generated tables, and the campaign driver, with a SHA-256 checksum |
Both builds are unreleased official builds of their main branches from the same week.
Summary
Section titled “Summary”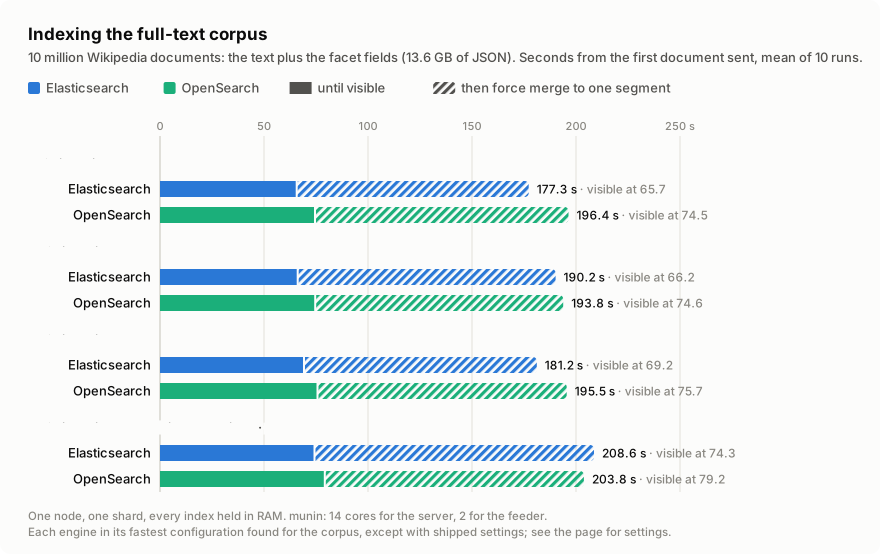
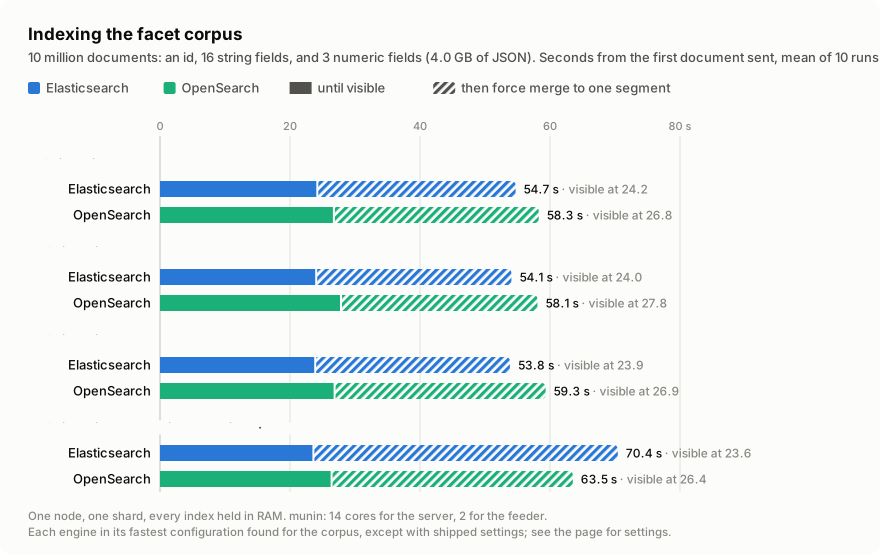
The solid part of each bar is the time until every document was searchable. The hatched part is the force merge to one segment that followed. The last group in each chart is the two engines with their shipped settings.
Results
Section titled “Results”Seconds from the first document sent, the mean of ten runs. ± is the standard deviation of the ten. Force merge is the time from visible to one segment, including a _flush before it. Server CPU-seconds run from the first document to one segment. Index is the data directory at one segment.
Full-text corpus
Section titled “Full-text corpus”| RAM | Engine | Acknowledged | Visible | Force merge | One segment | Server CPU-seconds | Index |
|---|---|---|---|---|---|---|---|
| 1 GiB | Elasticsearch | 60.6 s | 65.7 s | 111.5 s | 177.3 s ± 10.9 | 1,746 | 10.59 GiB |
| 1 GiB | OpenSearch | 71.4 s | 74.5 s | 121.9 s | 196.4 s ± 6.4 | 1,928 | 10.58 GiB |
| 2 GiB | Elasticsearch | 58.7 s | 66.2 s | 124.0 s | 190.2 s ± 7.5 | 1,738 | 10.58 GiB |
| 2 GiB | OpenSearch | 71.4 s | 74.6 s | 119.2 s | 193.8 s ± 5.2 | 1,926 | 10.59 GiB |
| 4 GiB | Elasticsearch | 55.4 s | 69.2 s | 111.9 s | 181.2 s ± 16.3 | 1,666 | 10.59 GiB |
| 4 GiB | OpenSearch | 71.9 s | 75.7 s | 119.8 s | 195.5 s ± 4.8 | 1,938 | 10.59 GiB |
Facet corpus
Section titled “Facet corpus”| RAM | Engine | Acknowledged | Visible | Force merge | One segment | Server CPU-seconds | Index |
|---|---|---|---|---|---|---|---|
| 1 GiB | Elasticsearch | 23.2 s | 24.2 s | 30.5 s | 54.7 s ± 1.4 | 547 | 1.96 GiB |
| 1 GiB | OpenSearch | 25.5 s | 26.8 s | 31.5 s | 58.3 s ± 2.3 | 629 | 1.95 GiB |
| 2 GiB | Elasticsearch | 23.1 s | 24.0 s | 30.0 s | 54.1 s ± 1.4 | 545 | 1.96 GiB |
| 2 GiB | OpenSearch | 25.4 s | 27.8 s | 30.2 s | 58.1 s ± 2.2 | 624 | 1.95 GiB |
| 4 GiB | Elasticsearch | 23.0 s | 23.9 s | 29.9 s | 53.8 s ± 1.3 | 545 | 1.96 GiB |
| 4 GiB | OpenSearch | 25.6 s | 26.9 s | 32.5 s | 59.3 s ± 1.1 | 631 | 1.95 GiB |
The two engines build indexes of the same size, with the same Lucene fields (see what each engine indexes).
Where Elasticsearch’s lead comes from
Section titled “Where Elasticsearch’s lead comes from”Until every document is visible, both engines keep most of the server busy: 22 to 25 of its 28 hardware threads on full text, and 21 to 22 on the facet corpus. So the time to visible follows the CPU work. To get there, OpenSearch spent 10% to 17% more CPU time than Elasticsearch on full text and 16% to 17% more on the facet corpus, and its documents were visible 9% to 13% and 11% to 16% later.
The force merge is different. Both engines kept about one hardware thread busy through it, and it took them about the same time: within 9% of each other at every level, with OpenSearch the quicker one at 2 GiB on full text. It is also most of the run: 61% to 65% of the time to one segment on full text, and 52% to 56% on the facet corpus. A Lucene merge runs on a single thread, except for vector graphs, which neither corpus has, and the last merge, the one that produces the single segment, has nothing to run beside it. The full comparison shows what running that step in parallel is worth.
On full text, Elasticsearch accepted the documents sooner with more indexing RAM, from 60.6 seconds at 1 GiB to 55.4 at 4 GiB, without making them searchable any sooner: 65.7 to 69.2 seconds. Its _refresh after the last document returned within 2 seconds in 9 of its 30 runs, and took 5.9 to 20.1 seconds in the other 21: 6 to 11 seconds at 1 and 2 GiB, and 19 to 20 at 4 GiB. OpenSearch’s took 0.1 to 8.6 seconds, 3.2 to 3.8 on average. On the facet corpus, both took 0.1 to 4.6 seconds.
Run-to-run variation
Section titled “Run-to-run variation”Elasticsearch’s full-text runs varied the most. Its time to one segment ranged from 157.9 to 201.7 seconds at 1 GiB, 183.1 to 204.3 at 2 GiB, and 164.9 to 218.0 at 4 GiB. OpenSearch’s ranged from 188.5 to 207.0, 187.3 to 200.5, and 189.3 to 203.8. Both phases contribute: the _refresh above, and the force merge, which took Elasticsearch 98.6 to 143.3 seconds across its 30 full-text runs and OpenSearch 112.1 to 135.6.
Pairing each Elasticsearch run with each OpenSearch run at the same level, Elasticsearch was faster in 92, 71, and 82 of the 100 pairs at 1, 2, and 4 GiB on full text, and in 91, 94, and 100 on the facet corpus. On full text, a single run of each can come out either way. The two engines’ runs were interleaved, so a drift in the machine over the campaign would have affected both alike.
With the shipped settings
Section titled “With the shipped settings”Elasticsearch and OpenSearch with their own index settings, at 2 GiB, three runs each. Only the mapping, one shard, and no replicas are set, so the refresh interval, merge auto-throttling, the translog, and merge threads are all at each engine’s defaults. The nodes are the same as above: 20 GiB heap, a 2 GiB indexing buffer, security off.
| Corpus | Engine | Visible | Force merge | One segment | Against its fastest configuration |
|---|---|---|---|---|---|
| Full text | Elasticsearch | 74.3 s | 134.4 s | 208.6 s ± 8.7 | 10% slower |
| Full text | OpenSearch | 79.2 s | 124.6 s | 203.8 s ± 7.5 | 5% slower |
| Facet | Elasticsearch | 23.6 s | 46.8 s | 70.4 s ± 2.1 | 30% slower |
| Facet | OpenSearch | 26.4 s | 37.1 s | 63.5 s ± 5.0 | 9% slower |
With shipped settings Elasticsearch still made the documents searchable first on both corpora, and lost the lead in the force merge: 134.4 seconds against 124.6 on full text, and 46.8 against 37.1 on the facet corpus, where its fastest configuration took 30.0. The full-text runs were fed by the earlier feeder, as were the full-text results above (see Feeding).
Configurations tried
Section titled “Configurations tried”Before the measured runs, I tried a set of settings on each engine at 2 GiB of indexing RAM and kept the fastest to one segment for each corpus. Each configuration starts from a bulk-load posture (refresh off during the feed, merge auto-throttling off) and changes one or two settings. A change was kept only if it beat the posture by more than 5%. Seconds to one segment, two runs each on the facet corpus and one on full text; the configuration used for each corpus is in bold.
| Configuration | Facet | Full text |
|---|---|---|
| Elasticsearch, bulk-load posture | 78.2 | 192.0 |
| Elasticsearch, 1 s refresh | 54.5 | 212.6 |
| Elasticsearch, 512 MB translog flush threshold | 56.8 | 214.0 |
| OpenSearch, bulk-load posture | 60.9 | 199.7 |
| OpenSearch, 14 merge threads | 57.7 | 206.7 |
| OpenSearch, 1 s refresh | 57.5 | 255.4 |
| OpenSearch, 1 s refresh and 14 merge threads | 59.9 | |
| OpenSearch, 10 GB translog flush threshold | 200.4 | |
| OpenSearch, 10 GB translog flush threshold and 14 merge threads | 195.5 |
The bulk-load posture was Elasticsearch’s fastest configuration on full text and its slowest on the facet corpus. There, Elasticsearch accepted all the documents in 20.5 seconds, sooner than in any other configuration, but the _refresh that made them searchable then took 15.6 and 16.5 seconds in the two runs. With a 1 s refresh, the documents were all accepted at 22.8 seconds and searchable 1.6 seconds later, and the force merge was shorter too (30.2 seconds against 41.7). After the same feed in the posture, OpenSearch’s _refresh took 0.2 and 3.9 seconds.
OpenSearch’s two facet changes tie. 14 merge threads also won an earlier one-run pilot (58.9 s against 61.9). On full text, OpenSearch with a 10 GB translog threshold and 14 merge threads was 2% faster than the posture, under the 5% bar. OpenSearch’s defaults on this machine are 4 merge threads and a 512 MB translog threshold.
How this was measured
Section titled “How this was measured”The two corpora
Section titled “The two corpora”Full text. The first 10,000,000 documents of the English Wikipedia line-document file that Lucene’s own benchmark suite, luceneutil, uses: Wikipedia from May 2012, split into chunks of at most 1,024 characters. Each document also carries the fields of the facet corpus below. It is the corpus of the full-text search benchmark.
Facet. 10,000,000 documents without the text: an id, nine string fields with 10 to 5 million distinct values, seven string fields marking nested subsets from 99% down to 0.01% of the documents, two integer fields, and a date. It is the corpus of the string faceting benchmark, and indexing it is mostly about building per-field structures, not about text analysis.
What each engine indexes
Section titled “What each engine indexes”Both engines get the same mapping: id and the string fields as keyword, body (full text only) as text with the standard analyzer, and the numbers as long, integer, and date with index: false and a doc values skip index, turned on with index.mapping.use_doc_values_skipper: true (Elasticsearch) or skip_list: true (OpenSearch). Neither builds a points index on the numeric fields.
To check that the two build the same thing, I read each engine’s finished segment with Lucene’s own API, using that engine’s jars. For every field, the internal metadata fields included, they record the same index options, doc values type, skip index, points, and norms. In both, the only field with points is _seq_no, the engine’s own per-document sequence number. Both keep _source, the whole original JSON of every document.
What is timed
Section titled “What is timed”Each run starts a fresh server on an empty data directory, creates the index, and then times, from the first document sent:
- Acknowledged: every
_bulkrequest has been answered. - Visible: a
_refreshsent right after has returned, so every document is searchable. Acknowledged documents are already durable in the transaction log, so a Lucene commit is not needed to make them searchable. - One segment: a
_flush, then_forcemerge?max_num_segments=1, then a_refresh, have returned. The_flushtook under a second in every run. Without it, Elasticsearch’s full-text runs often took this 64 GB machine below 2 GB of available memory near the end of the force merge, with every index held in RAM, and the harness stopped them.
Ending at one segment gives both engines the same finish line. “Done indexing” otherwise depends on where each merge policy happens to stop, and a single segment is how SearchBench serves its query benchmarks. After each run the harness checks that the index holds all 10,000,000 documents, live, in exactly one segment. The server’s CPU time comes from the kernel’s accounting for the server process.
Feeding
Section titled “Feeding”Both engines take 32 concurrent _bulk connections, each a kept-alive connection sending 1,000 documents per request and waiting for the response before sending the next. With 64 or 128 connections, both were no faster on the facet corpus. The document ids are generated by the engine, which lets both skip the check for an existing document. The feeder is SearchBench’s own and runs on the two cores (four threads) set aside from the server.
An earlier version of the feeder opened a new connection for every request and parsed every response in full. On the facet corpus that held both engines back by about 16% while they were still feeding, and put OpenSearch ahead, so the facet runs were all redone with the current feeder. The full-text runs are the earlier feeder’s: there the servers are the limit, and single runs with the current feeder came out inside the ranges above (201.5 s for Elasticsearch and 191.5 s for OpenSearch, at 2 GiB).
Engine settings
Section titled “Engine settings”- Indexing RAM:
indices.memory.index_buffer_size, set as an absolute size: 1, 2, or 4 GiB. It made little difference to either engine. - Heap: 20 GiB, five times the largest indexing buffer, on each engine’s bundled JDK. Elasticsearch ships Oracle’s build of OpenJDK 27 (
27.0.1.0.3+1-2) and OpenSearch ships Eclipse Temurin 25.0.5 (25.0.5+8-LTS). - Merge auto-throttling off (
index.merge.scheduler.auto_throttle: false) in every configuration except the shipped settings. - One shard, no replicas. Security off on both, and machine learning off on Elasticsearch.
- Not changed: thread pools, the garbage collector, JVM options other than the heap size, and translog durability (a sync per request, which costs next to nothing on tmpfs).
The full comparison lists everything that was done to make both engines fast.
Limits
Section titled “Limits”- In RAM. On a real disk, write bandwidth and sync costs would add to both engines’ times.
- One machine, one node, one shard, append-only. Updates and deletes, replicas, and multiple shards are not measured here.
- Each engine’s fastest configuration found, per corpus, from a short list of settings and few runs per setting. A setting not tried could change the order.
- Different JDKs. Each engine runs the JDK it ships with, which is part of what is being compared.
Revision history
Section titled “Revision history”- 2026-11-02: First publication. Elasticsearch 9.7.0-SNAPSHOT (main at
87a91d32c), OpenSearch 3.10.0 nightly 12323 (main atb86aeacb4), runs of 2026-11-01, SearchBench tagindexing-munin-20261101, raw results.